Operations | Monitoring | ITSM | DevOps | Cloud

Monitoring

The latest News and Information on Monitoring for Websites, Applications, APIs, Infrastructure, and other technologies.

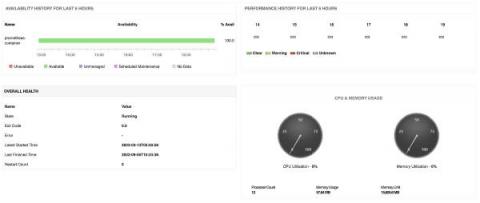
Docker monitoring 101: Tools, key features, metrics, and more

Docker is a well-known open-source platform that is predominantly employed to bundle applications and their dependent components into containers for easy development and deployment. Docker is lightweight and efficient in resource consumption by operating as an executable packaged software with all the necessary framework, libraries, code, runtime, and files required to run an application.

Tutorial: Querying InfluxDB with SQL and Grafana

Thank to a new and improved core database engine, InfluxDB now supports native SQL queries. Leveraging Flight SQL, InfluxData Developer Advocate, Jay Clifford, walks through how to set up querying InfluxDB using Grafana. He shows you how to configure Flight SQL and how to build a dashboard in Grafana for visualizing industrial IoT data.

Flowmon: How to Choose a Network Observability Platform

Individual EU Member States are expected to transpose the NIS2 and RCE directives into national What are the key characteristics organisations should have to shift from network monitoring to network observability? The need is to have more of a platform approach. Let´s see how to choose a Network Observability Platform to succesfully manage the networks in highly distributed environments.

WhatsUp Gold: How to Choose a Network Observability Platform

Individual EU Member States are expected to transpose the NIS2 and RCE directives into national What are the key characteristics organisations should have to shift from network monitoring to network observability? The need is to have more of a platform approach. Let´s see how to choose a Network Observability Platform to succesfully manage the networks in highly distributed environments.

OpenTelemetry Tracing: Everything you need to know

Applications are increasingly switching from the traditional monolithic design to a modern microservices-based design with several operational benefits. However, it also introduces challenges as conventional methods for collecting metrics and logs become ineffective due to the application design’s distributed nature.

How to Improve & Monitor Network Connectivity: The Step-by-Step Network Watchdog Guide

Are you tired of constantly experiencing buffering, lagging streams, or dropped calls? Have you ever wished you had a network watchdog to monitor your connection and alert you of any issues before they become a major headache? Well, you're in luck because we have just the tools and tips for you! In this step-by-step guide, we'll show you how to become a network watchdog yourself and use Network Monitoring tools to monitor your network connectivity like a pro.

How to monitor MySQL performance metrics in minutes

MySQL, a leading open source database for the past few decades, underpins potentially millions of applications, from tiny prototypes to internet-scale e-commerce solutions. The beauty of MySQL is not only its powerful relational database capabilities but also that it can be scaled up as the application grows. Why should you care about MySQL performance? Because MySQL is the backbone of many applications, your application performance will be inherently tied to your MySQL database performance.

Plan better and preempt bottlenecks with predict for metrics

Nothing is certain in this world except for death, taxes, and that you will eventually run out of disk space. You may have used our unique predict operator to query logs and forecast future values (we’ve even heard of customers predicting their ingest volume for Sumo Logic log data to better forecast their usage and budget!) — and wanted to do the same with metrics. With the recent general availability of the predict for metrics operator, you can.