Operations | Monitoring | ITSM | DevOps | Cloud
Monitoring
The latest News and Information on Monitoring for Websites, Applications, APIs, Infrastructure, and other technologies.
Accelerating Agencies' Hybrid Cloud Operations
Hybrid computing is the reality of most federal agencies today.
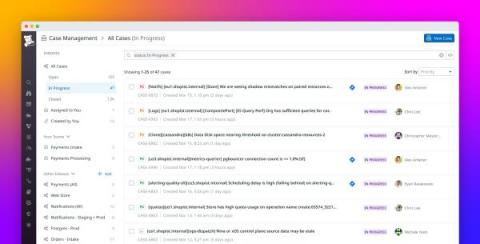
Proactively track, triage, and assign issues with Datadog Case Management
Complex systems require many different monitors to assess the health of their infrastructure and applications, creating a wealth of alerts that can be hard to track. Due to a lack of effective triage processes, many organizations page engineers for every alert that comes in, making it difficult to separate false positives from issues that actually require immediate attention.
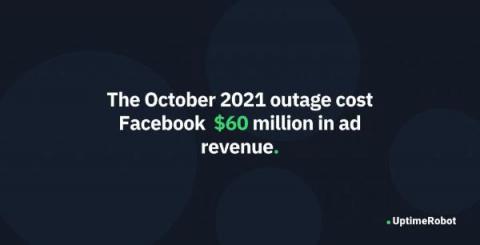
The Biggest Website Outages of All Time
As much as we all love the internet and everything it offers, we’ve also all experienced that sinking feeling when we try to access our favorite website, only to find it’s down. If you run your own site, you know that uptime is crucial for your online success — so that sinking feeling in your chest when your own website is down is … well, even worse. But let’s face it: even the internet giants aren’t immune to outages.
A Guide to OpenTelemetry for .NET Engineers
Hey.NET engineers! Today, we’ll explore the world of OpenTelemetry, focusing on how it can benefit your.NET applications. We’ll talk about the strengths and weaknesses of OpenTelemetry, walk you through the setup process, discuss the basics, and share some best practices. Plus, we’ll touch on topics like auto-instrumentation, metrics, and more. So, let’s dive in!
Grafana Cloud is now available in AWS Marketplace
Grafana Labs is excited to announce that Grafana Cloud is now available in AWS Marketplace. With this new offering, existing AWS customers can procure, deploy, and scale the fully managed Grafana LGTM observability stack (Loki for logs, Grafana for visualization, Tempo for traces, Mimir for Prometheus metrics) with just a few clicks.
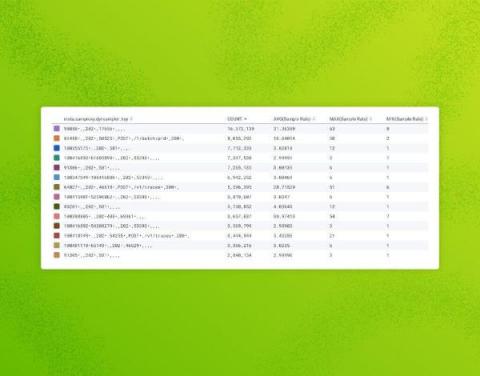
Achieving Great Dynamic Sampling with Refinery
Refinery, Honeycomb’s tail-based dynamic sampling proxy, often makes sampling feel like magic. This applies especially to dynamic sampling, because it ensures that interesting and unique traffic is kept, while tossing out nearly-identical “boring” traffic. But like any sufficiently advanced technology, it can feel a bit counterintuitive to wield correctly, at first. On Honeycomb’s Customer Architect team, we’re often asked to assist customers with their Refinery clusters.
What is SRE?
DevOps Pulse 2023: Increased MTTR and Cloud Complexity
Evolving DevOps maturity, mounting Mean-Time-to-Recovery (MTTR), and perplexing cloud environments – all these factors are shaping modern observability practices according to approximately 500 observability practitioners. While every organization faces its unique challenges, there are broadly impactful trends that arise.
Increasing Implications: Adding Security Analysis to Kubernetes 360 Platform
A quick look at headlines emanating from this year’s sold out KubeCon + CloudNativeCon Europe underlines the fact that Kubernetes security has risen to the fore among practitioners and vendors alike. As is typically the case with our favorite technologies, we’ve reached that point where people are determined to ensure security measures aren’t “tacked on after the fact” as related to the wildly-popular container orchestration system.


