Operations | Monitoring | ITSM | DevOps | Cloud

Monitoring

The latest News and Information on Monitoring for Websites, Applications, APIs, Infrastructure, and other technologies.

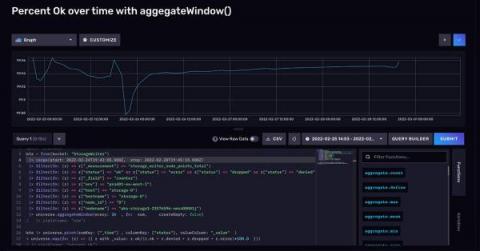
Cleaning and Interpreting Time Series Metrics with InfluxDB

A look at how to use Flux for data cleansing and analytics through the browser and via Visual Studio. Time series data is data you want to analyze and monitor over time. For example, you might want to know the water levels over the course of the day for a plant, or how much sunlight it receives and when. This is a simple but easy-to-understand example. Obviously on a larger scale the stakes can be higher.

Agent-based versus agentless data collection: what's the difference?

In the quest for a secure and reliable method to monitor their infrastructure, enterprises and service providers often find themselves exploring various agent-based and agentless solutions. Grasping the nuances between these two approaches is essential to select a monitoring service that aligns with your unique business requirements.

Elastic Observability 8.7: Enhanced observability for synthetic monitoring, serverless functions, and Kubernetes

Elastic Observability 8.7 introduces new capabilities that drive efficiency into the management and use of synthetic monitoring and expand visibility into serverless applications and Kubernetes deployments. These new features allow customers to: Observability 8.7 is available now on Elastic Cloud — the only hosted Elasticsearch offering to include all of the new features in this latest release.

Implementing OpenTelemetry in React applications

OpenTelemetry can be used to trace React applications for performance issues and bugs. You can trace user requests from your frontend web application to your downstream services. OpenTelemetry is an open-source project under the Cloud Native Computing Foundation (CNCF) that aims to standardize the generation and collection of telemetry data. React (also known as React.js or ReactJS) is a free and open-source frontend JavaScript library for building user interfaces based on UI components.

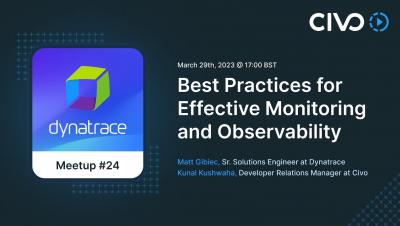
Best Practices for Effective Monitoring and Observability - Civo.com

In the first talk, "You're doing Observability wrong, breaking down the 3 pillars of observability," Matt Gibiec, Sr. Solutions Engineer at Dynatrace, will discuss the common misconceptions around observability and the importance of going beyond metrics, traces, and logs. He will break down the three pillars of observability and provide actionable insights into what is required to truly achieve observability in your systems.

The Comprehensive Guide to SNMP

Simple Network Management Protocol (SNMP) provides a standard message format that devices being monitored and monitoring systems can all speak – even though they will be running different operating systems. SNMP is the most widely deployed management protocol; it is simple to understand (although not always to use), and enjoys ubiquitous support.

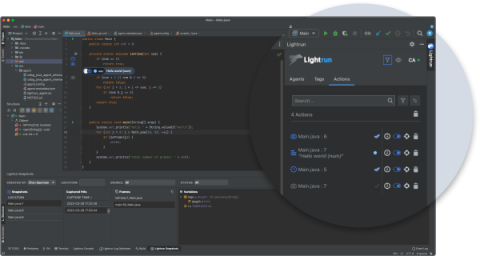
Lightrun's Product Updates - Q1 2023

During the past quarter, Lightrun has been busy at work producing a wealth of developer productivity tools and enhancements, aiming for greater troubleshooting of distributed workload applications and cost efficiency. Read more below the main new features as well as the key product enhancements that were released in Q1 of 2023!

The neglected tech arctic winter - Internal SaaS expenses

The current tech winter has a number of glaring stories — cyclical as they may be, there’s one truth that’s been gleaned over more than the rest; the money spent on internal software tools to support tech infrastructure is bloated. And there’s nothing cyclical about this infrastructure spending.

Troubleshooting Application Issues with Extended Labels

Troubleshooting issues in Kubernetes can be tough. When diagnosing these problems, you can find yourself with tons of microservices to review. Sometimes you come across the root cause straight away, but when dealing with complex issues you may lose a lot of time going back and forth, and time is a precious asset when everything goes up in flames. Sysdig Agent leverages eBPF for granular telemetry.