Operations | Monitoring | ITSM | DevOps | Cloud
Monitoring
The latest News and Information on Monitoring for Websites, Applications, APIs, Infrastructure, and other technologies.
OpenTelemetry-powered infrastructure monitoring: isolate and fix issues in minutes
How to monitor MySQL performance metrics in minutes
The Magic Behind the Lumigo Kubernetes Operator
Kubernetes is the container orchestration platform of choice for many teams. In our ongoing efforts to bring the magic experience of Lumigo’s serverless capabilities to the world of containerized applications, we are delighted to share with you the Lumigo Kubernetes operator, a best-in-class operator to automatically trace your applications running on Kubernetes.
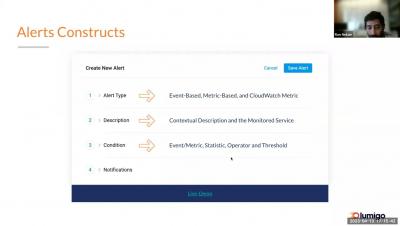
Lumigo Product Training: Actionable Alerts
Why do you need network monitoring?
Are you tired of dealing with network issues that slow down your business operations and create headaches for your network administrators? Be sure to fix problems you could have prevented before it's too late. Say hello to Network Monitoring! Imagine having a proactive approach to network management, where you can anticipate and prevent network issues from causing costly downtime.
High Cardinality? No Problem! Stream Aggregation FTW
High cardinality in time series data is challenging to manage. But it is necessary to unlock meaningful answers. Learn how streaming aggregations can rein in high cardinality using Levitate.
Monitoring your Express application using OpenTelemetry
Optimizing Your Splunk Experience with Telemetry Pipelines
When it comes to handling and deriving insights from massive volumes of data, Splunk is a force to be reckoned with. Its ability to index, search, and analyze machine-generated data has made it an essential tool for organizations seeking actionable intelligence. However, as the volume and complexity of data continue to grow, optimizing the Splunk experience becomes increasingly important. This is where the power of telemetry pipelines, like Mezmo, comes into play.
SQL Date Functions: A Detailed Guide
SQL provides a date type that developers can use to store date values. Also, to make working with dates easier, SQL has several date functions for retrieving, formatting, and manipulating dates. In this post, you’ll learn about some SQL date functions and how to use them.


