Operations | Monitoring | ITSM | DevOps | Cloud

Monitoring

The latest News and Information on Monitoring for Websites, Applications, APIs, Infrastructure, and other technologies.

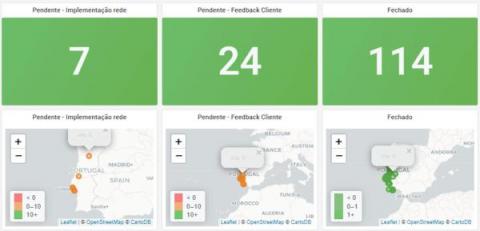
Troubleshoot in less than 60 seconds with Grafana: Inside NOS's observability stack

It may seem like ancient history, but there was a time when telecommunications companies only had to worry about connecting customers over landlines. Today, their businesses depend on vast cellular networks to not only provide strong wireless phone coverage in countless locations, but also handle the demands of tablets, computers, and machine-to-machine communications.

Software Project Managers: get total visibility of all your tools

Project managing global software projects is always a challenge, contending with multiple time zones, tools, and teams. In these environments, the day-to-day life of a Project Manager is filled with status collections, project reporting, and little time for much else. While the detail will always matter – like team bug data, feature status, and build progress – there is a better way than collecting and reporting on all this data manually. Does this scenario sound familiar?

Sponsored Post

The Importance of Observability for Site Reliability Engineers (SREs)

Site reliability engineers (SREs) play a crucial role in ensuring the reliability of systems. From creating software to improving system reliability in production, responding to incidents, and fixing issues, SREs are responsible for guaranteeing the health of applications.. And observability helps support SREs'. Because an observable system allows them to identify and fix issues promptly, resulting in SRE's being better equipped to fast-track development cycles.

Sponsored Post

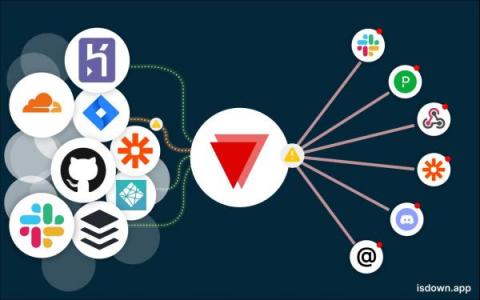
What's a Status Page Aggregator and why you need one

Welcome to the future! SaaS (Software as a Service) rules the world. When just a few years ago businesses were buying software and installing it in-house, now they're renting it. There's a SaaS for everything. Actually, multiple SaaS for the exact same problem! Even technology companies with expert engineering teams are choosing to use off-the-shelf components (now in the form of SaaS) instead of developing in-house. It makes complete sense to buy something that would cost 100x more to develop in-house.

Released: Better Uptime Integration

StatusGator has a wide a variety of use cases: from education to help desk to IT and managed services and DevOps, too. All corners of an organization depend on cloud services and StatusGator gives you visibility into the status of all of your vendors. We’ve heard over and over from our DevOps users that alerts and notifications for their teams are already centralized into a single incident management platform such as OpsGenie, PagerDuty, or FireHydrant.

How to convert a mini-arcade machine into a Grafana dashboard display with Raspberry Pi

When COVID-19 hit, Yonatan Mevorach faced an unexpected challenge, which required an unexpected solution. The Infrastructure Team Lead at Wix, the popular website building platform, was accustomed to looking at multiple monitors on the walls of the software company’s offices in Tel Aviv, Israel. These monitors cycled through Grafana dashboards to help the team keep tabs on Wix’s many services.

Just How Bad is a Down, Slow, or Dysfunctional Website? It's Worse than You Think!

Have you ever watched a movie (*cough* Godfather III) and said to yourself: “wow, this is so incredibly bad — I don’t think this can get worse!” But then it does. Much, much worse. Well, having a down, slow, or dysfunctional website is similarly nightmarish — just when you think the reputation devastation is finally over, there’s more on the horizon. With apologies to Shakespeare: hell hath no fury like a customer scorned. Not convinced?

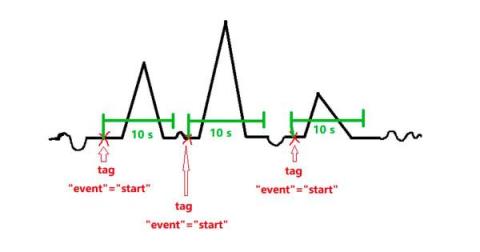
TL;DR InfluxDB Tech Tips: Joins

If you’re an InfluxDB user you’ve almost certainly used the join() function. The join() function performs an inner join of two table streams. It’s most commonly used to perform math across measurements. However, now it is deprecated in favor of the join.inner() function which is part of the new join package. With the addition of the join package, Flux now has the ability to perform the following types of joins: A visualization of different types of joins from this article.

Understanding the Observability Maturity Model

Based on research and conversations with enterprises from various industries, StackState created the Observability Maturity Model. This model defines the four stages of observability maturity. The ultimate destination is level four, Proactive Observability with AIOps. However, even moving from level one to two, or from level two to three, is a huge improvement in your ability to get essential insights into your IT environment.