Is too much data making your job harder? #youtubeshorts #dataanalytics #observability
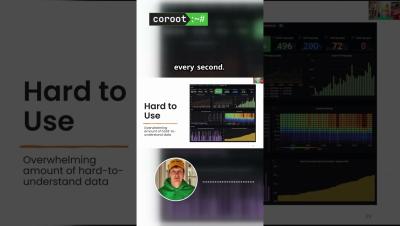
What happens when capturing vast amounts of data becomes overwhelming instead of insightful? For years, vendors have prioritized collecting vast metrics, boasting thousands of data points. But is this approach beneficial, especially for developers who may not be observability experts? Understanding metrics shouldn't feel like deciphering a foreign language. Coroot is an open source observability platform that helps engineers fix service outages and even prevent them. It continuously audits telemetry data to highlight issues and weak spots in your services.