Operations | Monitoring | ITSM | DevOps | Cloud
Monitoring
The latest News and Information on Monitoring for Websites, Applications, APIs, Infrastructure, and other technologies.
Make Your MSP a Recession-Proof Business
Part 4: Causal Observability - Level 3
It’s not surprising that most failures are caused by a change somewhere in a system, such as a new code deployment, configuration change, auto-scaling activity or auto-healing event. As you investigate the root cause of an incident, the best place to start is to find what changed. To understand what change caused a problem and what effects propagated across your stack, you need to be able to see how the relationships between stack components have changed over time.
APM/ RUM: Learn about the latest updates and what's coming
[Sensu Go Workshop] Lesson 1: Introduction to Sensu
Quick Bytes - Getting started with ECS monitoring
[Sensu Go Workshop] Lesson 2: Set up the Workshop Environment
Grafana alerts as code: Get started with Terraform and Grafana Alerting
Alerting infrastructure is often complex, with many pieces of the pipeline that often live in different places. Scaling this across many teams and organizations is an especially challenging task. As organizations grow in size, the observability component tends to grow along with it. For example, you may have many components, each of which needs a different set of alerts. You may have several teams, each with a different channel where notifications should be delivered.
Harness Continuous Observability to Continuously Predict Deployment Risk
In my previous blog, I discussed how continuous observability can be used to deliver continuous reliability. We also discussed the problem of high change failure rates in most enterprises, and how teams fail to proactively address failure risk before changes go into production. This is because manual assessment of change risk is both labor intensive and time consuming, and often contributes to deployment and release delays.
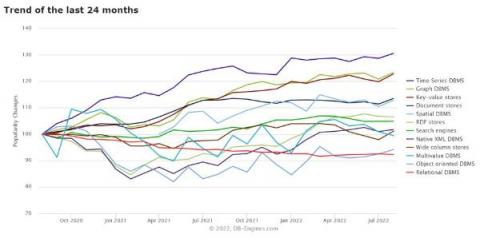
Relational Databases vs Time Series Databases
Databases are often the biggest bottleneck when it comes to application performance. Over the years a number of new database designs have emerged to help with not only basic scalability and performance but also to help improve developer productivity and make building certain types of applications easier. That isn’t to say these new databases are magical — there are always trade-offs being made and certain things are sacrificed for gains in other areas.


