Operations | Monitoring | ITSM | DevOps | Cloud

The latest News and Information on Monitoring for Websites, Applications, APIs, Infrastructure, and other technologies.

Selector Named a 2024 Best Place to Work in the Bay Area

For the second consecutive year, Selector has been recognized as a Best Place to Work in the Bay Area. In 2023, the company was ranked among the top 10 companies with 25–49 employees. This year, the company ranked again in the top 10. This regional award is sponsored by the San Francisco Business Times and Silicon Valley Business Journal in collaboration with Quantum Workplace—an employee engagement data firm.

Writing Your First Visual Regression Check in Playwright

Visual regression testing ensures that your web application looks as expected and that any visual changes are intentional. These tests amount to comparing two screenshots and looking for pixels that are different. With Playwright, you can achieve this with just a few lines of JavaScript. Let's walk through the process using a simple example. Once we’ve done a visual regression test start to finish in Playwright, we’ll show how you can add Checkly tools to create visual regression monitors.

Focus on code that matters with source code previews in Continuous Profiler

The use of code profiling to troubleshoot application performance can appear daunting to the uninitiated, and many software engineers even assume that this domain is reserved for niche specialists. But here at Datadog, one of the key goals for our Continuous Profiler product has been to take this seemingly intimidating practice of code profiling and make it more accessible to engineers at all levels.

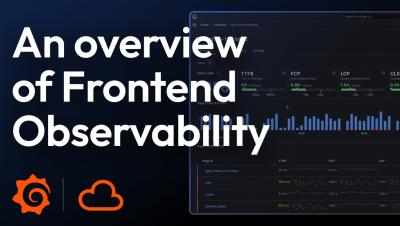
How Dell successfully migrated to Grafana Cloud and consolidated its observability in the process

While some monitoring tools excel at a specific task, observability works best when you have a holistic view of your system. You need a platform capable of working with all of your telemetry collectively, otherwise you can end up with a complex, inefficient, and expensive collection of incongruent, siloed tools. That’s what one team at Dell Technologies realized before they made a switch to Grafana Cloud last year.

Lessons From Our Fathers: On Network Operations Tools and Expertise

“It’s the network again.” That is what most people think of when they experience degradation in their digital interactions. Whether it’s an app that won’t load, a 404 error, or garbled speech in a streaming conversation—the network’s reputation always seems to take a hit when things go wrong. Battling this perception with facts is essential. This requires knowing what’s up, what’s down, and what’s affected.

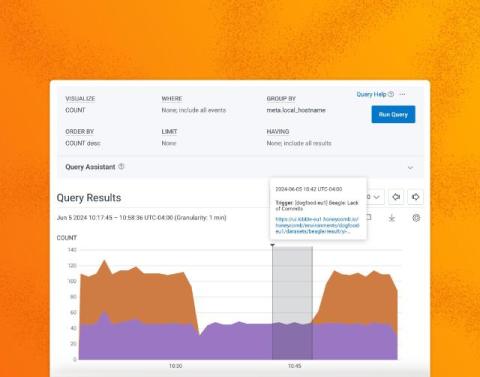
Curated dashboards in Honeybadger

Earlier this year, we introduced a new logging and performance monitoring tool, Honeybadger Insights. You can finally send your logs, application events, and telemetry data to Honeybadger! Once you do, you can query your logs and events to diagnose performance issues, perform root-cause analyses, and create beautiful charts and dashboards to see what's happening in real time.

Mastering Linux Logging with ELK: A Step-by-Step Guide

The ELK (Elasticsearch, Logstash, and Kibana) stack is a centralized logging solution that provides users with comprehensive log searches in a single location. The extensive features and varying uses that the solution offers have led to it becoming one of the most popular tools currently available.

Beyond Default Settings: Customized Monitoring with Progress WhatsUp Gold

A monitoring solution cannot monitor all potential failure points directly out of the box, which is why being able to customize your monitoring solution is pivotal. Network availability and performance are crucial for your company’s day-to-day operations. Customers, employees, executives and business partners rely on easier access to your applications, services and data.