Operations | Monitoring | ITSM | DevOps | Cloud

The latest News and Information on Observabilty for complex systems and related technologies.

Why Internal Agents Must Be Rebuilt with Runtime Context

As we entered 2026, enterprises raced to build internal AI engineering agents, automating incident response, code review, and support. The investment was real, but 88% of these pilots never reached production, and teams are now in rebuild mode, trying to understand why. Live runtime validation was the key architectural decision skipped in these v1 agents and it’s still missing from many v2 designs. Agents need to verify their reasoning against production before they act.

Build a Docker Monitoring Dashboard in Minutes with Claude MCP + Uptrace

In this video, we use Claude MCP to create and merge Docker container dashboards in Uptrace — directly from the terminal, no manual clicking required. What you'll see: CPU, memory, network, and disk I/O dashboards created with plain text prompts Two dashboards merged into one unified view Dashboard exported as YAML for version control.

Introducing Harness AgentTrace: An Observability and Guardrail Framework for AI Agents | Harness Blog

AI agents fail differently from the software we spent the last two decades learning to monitor. We hear some version of the same story from teams shipping agents to production: an agent starts producing wrong answers. Not obviously broken: confident, well-formatted, plausible wrong. The logs are clean, latency looks healthy, and error rates sit at zero. Nothing flags a problem. A user eventually does.

Security Observability: Pillars, Use Cases, and How It Works

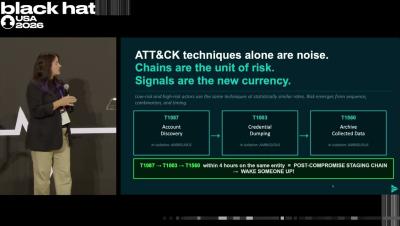
When an alert lands, does your team already see the full story, or does the work start with pulling scattered data together from one tool after another? For many organizations it's the second one, where the incident itself takes a backseat while analysts hunt across dashboards. The evidence is right there, scattered across platforms that don't share context. Security observability exists to close that gap.

SDLC Phases and the Reliability Gap AI Can't Close

Decisions in each SDLC phase from planning to design, development, testing, deployment, and maintenance are made without sight of live production behavior. AI coding agents are widening that visibility gap faster, working faster than human engineers ever could. This piece maps exactly how this gap presents at each phase, and the harm that this brings.

GPU Observability with the OpenLIT Collector and the VictoriaMetrics observability stack

This post is a joint effort by the OpenLIT and VictoriaMetrics teams. OpenLIT brings the OTel-native GPU collector for NVIDIA, AMD, and Intel hardware, while VictoriaMetrics provides the storage and query layer for the resulting metrics. We wrote it together to show how the two projects fit into a single, self-hosted observability pipeline, and to share the queries and rules that worked well for us along the way.

Instant Kubernetes Observability with Proxymock #speedscale #kubernetes #ebpf #devops #cloudnative

Learn how to get instant observability into your Kubernetes cluster by installing the Speedscale operator and proxymock tool. In this step-by-step tutorial, we walk you through setting up the operator to capture live network traffic (including encrypted traffic, API calls, and database calls) without complex instrumentation or manual configuration.

Let's break autovacuum in Postgres: reproducing failures to make it observable

Autovacuum is one of those Postgres background jobs that quietly keeps your database healthy. It cleans up the dead row versions that every UPDATE and DELETE leaves behind, and it keeps the database away from a hard transaction-ID limit that would take it offline. Most of the time you don't think about it, because it just works.

Adding Routing Intelligence To Your Observability Stack

Observability has a blind spot, and for most teams it sits at the network layer. You instrument your services, scrape metrics into Prometheus, ship logs somewhere searchable, and build dashboards that tell you when something is wrong inside your infrastructure. But the routing that carries traffic to and from that infrastructure often lives entirely outside the stack, watched through separate tools that do not talk to your alerting. This piece looks at why routing belongs in your observability pipeline and what it takes to get it there.

Beyond performance monitoring: Understand the user experience with Grafana Cloud Frontend Observability

You've optimized your Largest Contentful Paint. Your Time to First Byte is under 200ms. Your Lighthouse scores are green. And yet, your checkout conversion rate is quietly dropping. A segment of users in Southeast Asia is churning. Your support team is fielding tickets about a form that "just doesn't work" and you have no idea which one. Traditional frontend performance monitoring tells you whether your application is fast. It doesn't tell you whether people are actually succeeding when using it.