Operations | Monitoring | ITSM | DevOps | Cloud

APM

The latest News and Information on Application Performance Monitoring and related technologies.

Sponsored Post

JS Toolbox 2024: Frameworks and static site generators

In 2024, JavaScript is bigger than ever. The ecosystem is just as huge, and almost impossible to keep track of - so I've had a go at picking out 2024's most essential JS tools for you. In part 1 of this series, we reviewed runtimes and package managers, the foundational building blocks of your software project. So in part 2, we're analyzing the tools which form the walls and roof that give your software project its structure: frameworks and static site generators. For this installment of JS Toolbox 2024, we explore various frameworks & generators available in the JavaScript & TypeScript ecosystem, analyzing their strengths, weaknesses, and ideal use cases.

This Month in Datadog: Bits AI for Incident Management, KSPM, New Observability Pipelines, and more

Datadog is constantly elevating the approach to cloud monitoring and security. This Month in Datadog updates you on our newest product features, announcements, resources, and events. To learn more about Datadog and start a free 14-day trial, visit Cloud Monitoring as a Service | Datadog. This month, we put the Spotlight on Bits AI for Incident Management.

Cisco announces standalone Secure Application, offering increased flexibility to security teams

Cisco's Secure Application is now available as an independent application on the Cisco Observability Platform and can be deployed with or without Cisco Cloud Observability. This announcement increases the flexibility offered to IT professionals and allows in house security teams to harness powerful security capabilities without committing to cloud native application performance monitoring.

Announcing AI Error Resolution

After months of anticipation (and invaluable input from our beta testers!) we’re so excited to officially share AI Error Resolution. We can say firsthand that this tool helps developers resolve issues with renewed speed and accuracy, using AI-powered suggestions on the root cause of errors and how to fix them. Testing has shown how effectively this feature can pinpoint the source of an error and produce the most efficient method to resolve it, accelerating the entire debugging process.

Jaeger vs Tempo - key features, differences, and alternatives

Both Grafana Tempo and Jaeger are tools aimed at distributed tracing for microservice architecture. Jaeger was released as an open-source project by Uber in 2015, while Tempo is a newer product announced in October 2020. Jaeger is a popular open-source tool that graduated as a project from Cloud Native Computing Foundation. Grafana Tempo is a high-volume distributed tracing tool deeply integrated with other open-source tools like Prometheus and Loki.

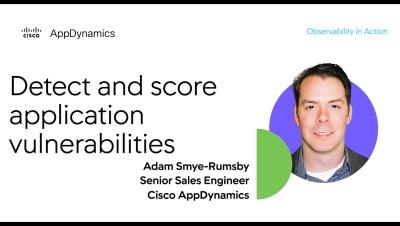
Detect and score application vulnerabilities

With AppDynamics and Cisco Secure Application, you can quickly identify where application vulnerabilities exist and gain insights as to how best to remediate them based on business risk observability. Let technology work for you by keeping up with the most recent vulnerabilities and help you prioritize what to remediate based on business risk.

Checkly adds deep synthetic monitoring to Coralogix with new integration

Starting today, Checkly users can send their traces from synthetics checks to Coralogix to view in-depth synthetic user data along with back-end APM based tracing. This gives SRE’s and Operations engineers a new insight into how the system is responding to automated synthetic tests of your service. For Checkly users, integrating with Coralogix data means it’s easy to correlate end-to-end user experience with backend performance, and track poor performance to its root cause.

And What About my User Experience?

Monitoring backend signals has been standard practice for years, and tech companies have been alerting their SRE and software engineers when API endpoints are failing. But when you’re alerted about a backend issue, it’s often your end users who are directly affected. Shouldn’t we observe and alert on this user experience issues early on? As frontend monitoring is a newer practice, companies often struggle to identify signals that can help them pinpoint user frustrations or performance problems.

What is an Anomaly? Avoiding False Positives in Watchdog Detected Anomalies

In 2018 Datadog released Watchdog to proactively detect anomalies on your observability data. But what defines an anomaly? How do you avoid false positives? At Datadog Summit London 2024, Nils Bunge, product manager at Datadog, shared the story of the creation of the first Datadog AI feature (Watchdog Alert), what we learned from it and how we applied those lessons to all the added AI functionalities across the years.