Operations | Monitoring | ITSM | DevOps | Cloud

NodeJS

Sponsored Post

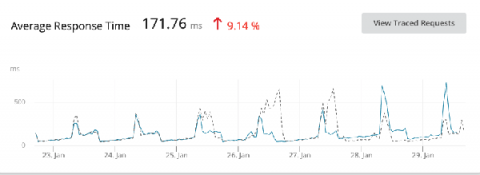
Gain more visibility into code performance with Raygun APM for Node.js

Raygun has been busy building our best-in-class APM so you can provide flawless digital customer experiences. By adding Raygun Application Performance Monitoring to your monitoring suite, your team will gain more visibility on code and server performance, achieve a faster time to resolution with finer granularity, and reduce infrastructure costs by optimizing existing services. Raygun is a developer-friendly product that surfaces more diagnostic details than other APM solutions. Combined with our usage-based pricing, we have the ability to provide companies like Olo with millions of customers with cost-efficient and powerful APM.

Monitoring Node.js Application With AppOptics on DigitalOcean - Better Together

Many teams take advantage of the convenience of deploying their apps to the platform as a service (PaaS) providers such as DigitalOcean. Cloud solutions like this are an easy way for teams to deploy and scale their applications without worrying about the details. However, even in these managed environments, poorly written apps can cause issues. If your pages load too slowly, users will likely leave your site and look for another.

Monitoring Node.js Health and CPU Usage

What’s the most wanted feature for a Node.js application? Well, high performance with no downtime is one of the top answers for this question. But how do you accomplish this? Monitoring is key to gain a better understanding of the health of your application. For example, by implementing monitoring, you can detect problems, such as a memory leak or long-running processes that block the Node.js event loop.

Improving Node.js Application Performance With Clustering

When building a production application, you are usually on the lookout for ways to optimize its performance while keeping any possible trade-offs in mind. In this post, we’ll take a look at an approach that can give you a quick win when it comes to improving the way your Node.js apps handle the workload. An instance of Node.js runs in a single thread which means that on a multi-core system (which most computers are these days), not all cores will be utilized by the app.

Node.js Error Handling Made Easy: Best Practices On Just About Everything You Need to Know

Don’t you hate it when you see an uncaughtException error pop up and crash your Node.js app? Yeah… I feel you. Can anything be worse? Oh yeah, sorry, unhandledRejection I didn’t see you there. What a nightmare you are. 😬 I maintain all Node.js open-source repos at Sematext. A few of them can help you out with error handling, but more about that further down. Here at Sematext, we take error handling seriously! I want to share a bit of that today.

Node.js Garbage Collection: Heap Statistics Magic Dashboard

We just released a Magic Dashboard for Garbage Collection stats for our Node.js integration. If you are leaking memory, this dashboard will help you discover and fix this problem. No setting up is required, this dashboard will magically automatically appear among the rest of your dashboards. ✨

Node.js Logging Made Easy: A Tutorial on Just About Everything You Need to Know

Building SaaS products is hard. Making customers happy is even harder. I should know, I’ve built a start-up that failed! But, not everything is that bad. I learned a lot. Now I maintain a few open-source Node.js projects at Sematext. It’s an observability SaaS. I joined to help make the log management features as good as they can be. If you’ve never heard that term before, my co-worker wrote a great introductory explanation of what Log Management is right here.

Instrumenting Node.js for Tracing in Jaeger

There is more to Distributed Tracing with Jaeger than just capturing machine data as with metrics, or tailing log files. To start, you should read this primer. In this article, I will walk you through the initial principles you’ll need before executing anything within your codebase. This is going to focus on Node.js, as slight differences and concerns exist for browser applications.

The Easiest Way to Monitor Node.js: Automatic Instrumentation

Monitoring for your Node.js apps can be hard. The tricky part is understanding what you need to monitor, instrumenting your code, and then making sense of all the data that’s been emitted. (That’s almost every part you might say 😅 ). At AppSignal, we dogfood our product and understand the pain users feel ourselves. The key points we focus on are the ease of use, flexibility, and developer experience.

Support for Database Performance Monitoring in Node

Performance monitoring is great because it lets you see whether your application is fast or slow, and which parts need speeding up. For Node developers, those “parts” are most often endpoints handling incoming requests. Since the introduction of our performance monitoring offering in July 2020, Node devs have been able to use the Sentry SDK, @sentry/node, to measure the total time it takes to process each request, but we made some significant improvements since then.