Infovista partners with VMware to bring Automated Assurance and Operations to multi-cloud environments
Announces deployment of Ativa™ Suite on VMware Tanzu multi-cloud platform.


Alloy Software Inc. today unveils a brand-new mobile experience for end-users of its Alloy Navigator ITAM/ITSM suite. The new app offers mobile users the ability to report issues and track their progress, request services from the IT team, search for answers in the knowledge base, reserve equipment for temporary use, and more.
Picking the best iOS crash reporting tools available in 2023 is a tall order. The market has continued to get more competitive, and a best-in-breed tool needs to monitor crashes, generate crash reports, filter and group errors, plus perform other tasks on top. In this article, we’ve collected the 15 best iOS crash reporting tools to help you make the right decision for your particular requirements.
Mobile devices have changed our world. They come with us everywhere and provide invaluable services. One nagging problem is how to get data out of your mobile device. Specifically, logging metrics and events can be a trial. Opening up a public-facing port, managing the log receivers, coding… Wouldn’t it be nice if this was simplified? This article will demonstrate how easy delivering logs can be using Cribl.Cloud and simple HTTP POSTs – for free.
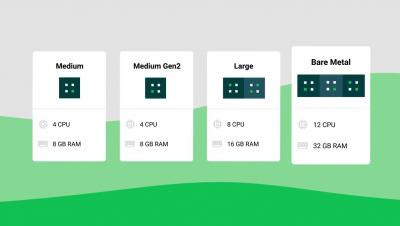
Now that we have discussed the networking part , the next step is placing the application into a host. Robin.io’s cloud platform has the concept of master, compute, and storage nodes. Typically, the hardware servers would have multiple NUMA nodes. In order to achieve the best performance, the platform should utilize the resources from the same NUMA node. Failing this – if users are consuming a resource from another NUMA node – then their performance would degrade.
Profilers measure the performance of a program at runtime by adding instrumentation to collect information about the frequency and duration of function calls. They are crucial tools for understanding the real-world performance characteristics of code and are often the first step in optimizing a program. Apple and Google have first party profiling tools, but they are only usable for local debugging during development.
When you’re on-call for a critical service and get alerted to an issue that could impact customers, you need quick access to key performance metrics in order to effectively troubleshoot. But all too often, digging into this data requires you to switch from your mobile device to a laptop, restricting your ability to troubleshoot on the go and disrupting your routine.