For teams that build or maintain modern applications with their end-users in mind, the acquisition of Rigor means that Splunk now offers the most comprehensive synthetic monitoring solution on the market. Rigor, now Splunk Synthetic Monitoring and Web Optimization, provides best-in-class synthetic monitoring capabilities enabling IT Ops and engineering teams to detect and respond to uptime and performance issues within incident response coordination and throughout software development lifecycles.
Written by Nick Cavalancia, Microsoft Cloud & Datacenter MVP The need for visibility into service availability and delivery quality has led to the rise in interest in monitoring Microsoft’s Office 365 services from the user perspective. With two different approaches available, what value do they each bring?
Knowing how your users interact with your web application and how they experience it is crucial to provide the best possible experience. So what do you need to know? Start with metrics such as page load times, HTTP request times, and core Web Vitals – time to the first byte, first contentful paint. If you use Sematext Experience you’ll see a number of other useful metrics for your web applications and websites there. However, metrics themselves are only a part of the whole picture.
In May 2020, Google introduced Core Web Vitals, a set of three metrics that serve as the gold standard for monitoring a site’s UX performance. These metrics, which focus on load performance, interactivity, and visual stability, simplify UX metric collection by signaling which frontend performance indicators matter the most.
As an industry-leading provider of the most comprehensive Microsoft 365 monitoring solution, Martello is in a class all its own; our digital experience monitoring solution features key capabilities that help IT teams identify when and where cloud application performance issues are happening and how to best mitigate the impact.
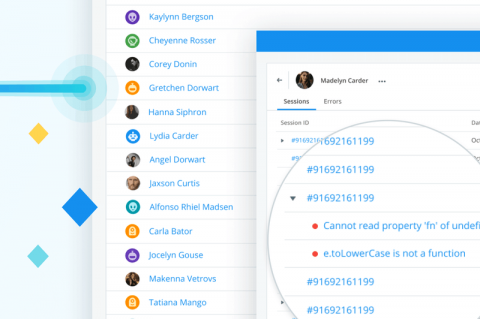
In this How-To video, we’re going to look at Real User Monitoring in the context of how you can apply it to a specific use case. Real User Monitoring, or RUM, is an event-based solution for monitoring customer experience. In other words, it measures the performance of a webpage from the perspective of the user’s machine. In our previous video on RUM, we looked at how to set up a RUM tag. Today, we’ll specifically examine RUM data in the context of improving SEO scores.
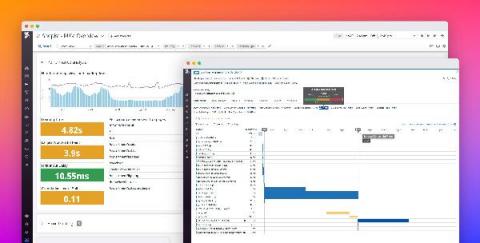
Without unified visibility across your entire stack, it can be difficult to investigate backend dependencies when troubleshooting frontend issues, or to track the source of database failures that originate from bad browser requests. Full-stack visibility gives you the insight you need to pinpoint and resolve incidents quickly.