Operations | Monitoring | ITSM | DevOps | Cloud

UptimeRobot August 2021 Update: Configurable Timeout, support improvements and Plesk extension

We’ve been busy this summer and introduced two new features last month – longer intervals and a grace period for recurring jobs monitoring (Heartbeat monitors). There is some good news this month too, so let’s get right into it!

It's Here! Monitor Microsoft Teams Audio Video Conferencing

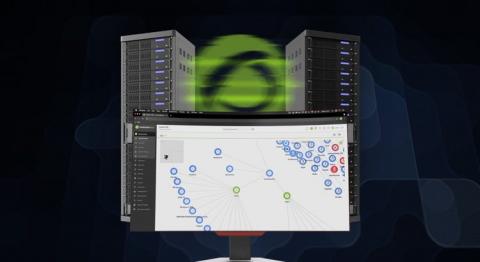
Exoprise released its long awaited Teams Audio Video Conferencing sensor. This sensor fully tests Audio/Video end-to-end capacity, throughput, and network performance through the actual underlying Microsoft Teams and Azure infrastructure. The Teams AV sensor provides deep insight into a network’s capability to handle the Teams/Skype Unified Communications (UC) platform.

What's new in Grafana Cloud for September 2021: New panels, query caching, synthetic monitoring updates, and more

Here at Grafana, we’re constantly shipping new features to help our users get the most out of Grafana Cloud. Over the last few months, we’ve made it even easier to get started with out-of-the-box dashboards and new visualizations in Grafana Cloud. We also introduced capabilities like query caching, a “prettify JSON” option and commands for cortex-tools to make your data, dashboards, and queries more efficient.

What's New: Introducing the PagerDuty App for Salesforce Service Cloud

In today’s world of digital everything, where customers are increasingly demanding instant updates when problems occur, it’s more important than ever to take immediate action. Seconds matter, and teams need to be empowered to proactively solve customer-impacting incidents as quickly as possible.

Logz.io's New Lookz is Generally Available!

Back in June, we announced the Public Beta for Logz.io’s New Lookz – which is a new UI that completely changes the way users navigate across Logz.io products and features. The Public Beta gave users the option to toggle between the old and new UIs to see which one they liked better. And the answer from our users was as clear as it could be.

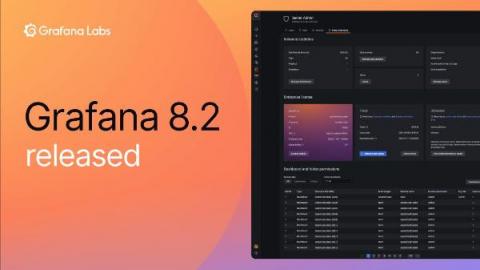
New in Grafana 8.1: Gradient mode for Time series visualizations and dynamic panel configuration

Grafana 8 brought with it many exciting new features, including the launch of a new alerting system and the expansion of Grafana’s live and streaming data functionality. We didn’t stop there. In Grafana 8.1, alongside new additions like the Geomap and Annotations panel, we introduced some new features to the Time series panel as well as two transformations to help make panel configuration more dynamic.