Operations | Monitoring | ITSM | DevOps | Cloud

Why we moved from Slack to Discord?

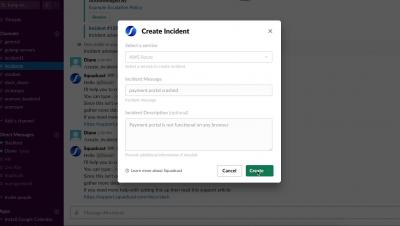
Today, at Qovery we have moved from Slack to Discord. We are a software company that is solving developer problems - application deployment. Solving developer problems required to have a close contact with the developers community. For team communication, we used a dedicated Slack workspace, for community communication - another one. Discord has been a real lifesaver for us. Let's start to tell you why..

How living in a bubble helped us ship on time

Late last year, the Confluence team introduced the 7.0 platform release for Server and Data Center customers. It was our first platform release since 2016, and it focused on delivering improvements to administration, team productivity and enterprise needs. After a months-long development cycle, we shipped within a week of our goal – not too shabby, if I do say so myself!

Introducing Grafana Cloud Agent, a remote_write-focused Prometheus agent that can save 40% on memory usage

Today, we are announcing the Grafana Cloud Agent, a subset of Prometheus built for hosted metrics that runs lean on memory and uses much of the same battle-tested code that has made Prometheus so awesome. At Grafana Labs, we love Prometheus. We deploy it for our internal monitoring, use it alongside Alertmanager, and have it configured to send its data to Cortex via remote_write. Unfortunately, as we scale to handle more load, our deployment becomes more and more difficult to manage.

Facade Pattern in Rails for Performance and Maintainability

In today’s post, we will be looking into a software design pattern called Facade. When I first adopted it, it felt a little bit awkward, but the more I used it in my Rails apps, the more I started to appreciate its usefulness. More importantly, it allowed me to test my code more thoroughly, to clean out my controllers, to reduce the logic within my views and to make me think more clearly about an application’s code’s overall structure.

Top Monitoring Tools for DevOps Engineers and SREs

Monitoring has moved from a simple proactive practice to a necessity on any product launch checklist. It is crucial to pick a tool that meets your observability needs & ensures reliability of your service to your customers. Over the years, with an increase in adoption of DevOps and SRE practices, Monitoring has moved from a simple proactive practice to a necessity on any product launch checklist.

Overcoming DNS barriers for Kubernetes Scaling

It was a cloudy winter morning when I had arrived at the office and found, to our horror, that a Kubernetes cluster was suffering from extremely high CPU and network usage and had become almost completely non-functional. To make things worse, restarting the nodes (the go-to DevOp solution), seemed to have absolutely no effect on the issue. Something was poisoning the network and we had to find out what it was and fast.