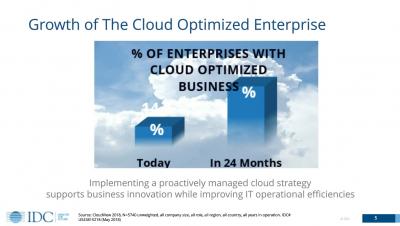
IDC: Applying Advanced Analytics and Machine Learning to Modern Network Architectures
Learn how applying AI & ML to modern network architectures can accelerate the evolution toward digital transformation.


Time is running out to get your ticket to GrafanaCon LA, but you can still grab one of the last remaining seats. We’re really excited how the schedule has shaped up and hope you can join us!
Digital, network-connected systems are transforming every aspect of business — from your mission-critical workloads to your most rarely used applications. But the increases in scalability and cost efficiency come at a cost. Because every system is so reliant on network connectivity, unplanned downtime is becoming increasingly expensive.
If you’re a software developer, then you understand how vital application logging is in software development and a critical part of logging is something called logging levels. Log entries generally contain essential information—such as a timestamp, a message, and sometimes additional stuff like an exception’s stack trace. Those pieces of information are useful because they allow someone reading the log entry to understand how the application behaved in production.
Kafka and the ELK Stack — usually these two are part of the same architectural solution, Kafka acting as a buffer in front of Logstash to ensure resiliency. This article explores a different combination — using the ELK Stack to collect and analyze Kafka logs. As explained in a previous post, Kafka plays a key role in our architecture. As such, we’ve constructed a monitoring system to ensure data is flowing through the pipelines as expected.
At Honeycomb, we’re pretty engineering-focused. We think our product is something every developer can benefit from, and we’re working to build something we would want to (and do!) use every day to make our own jobs easier.