Operations | Monitoring | ITSM | DevOps | Cloud

Analytics

ELMAH Is Dead. Get More Detailed Exceptions With Retrace

For many years, ELMAH was the go-to logging utility for ASP.NET. It caught exceptions that came up through the IIS response pipeline and logged them along with contextual information. It also put a subpage on your site that you could visit to view logged exceptions. It was a great tool for catching, logging, and viewing unhandled exceptions for monolithic ASP.NET applications. But now that we’ve moved to distributed application architectures, we need something more.

Pro Tips: Using Grafana in Quality Assurance

Quality assurance is a priority at Evolution Gaming, the world leader in live casino gaming, and as Andrejs Kalnacs, Lead Software Developer in Test, said during his GrafanaCon EU talk in March, Grafana has been a game changer. While Kalnacs and his team have found Grafana to be invaluable in many areas, here are three best practices they’ve learned throughout their journey.

Top Use Cases for Log Analysis

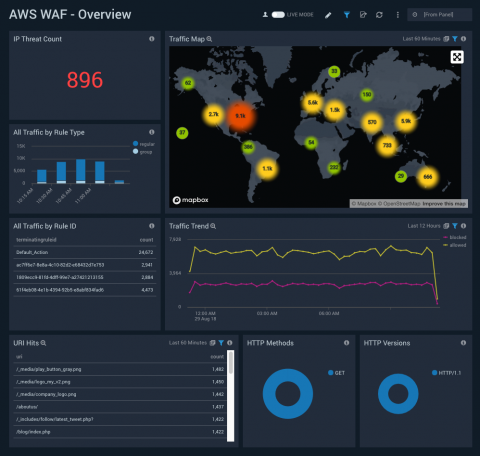
Investing in a log analysis tool provides many benefits: it saves time needed to detect and troubleshoot a problem, reduces churn by providing a better user experience, and improves system security. There is a wide scope of use cases for log analysis - from tackling security and performance issues head-on to enhancing the quality of your services. What are some of the most common use cases for log file analysis?

LogDNA Announces New Log Management Capabilities on IBM Cloud

LogDNA today announced a new offering that enables developers to troubleshoot coding bugs and quickly fix development errors in applications, potentially saving businesses millions of dollars in development hours, downtime and associated revenue loss. IBM Log Analysis with LogDNA integrates LogDNA services to allow developers to aggregate all their log data across applications in the IBM Cloud.

What's New in Elastic Stack 6.5

Elastic Stack 6.5 is out! Every new version of the Elastic Stack is packed with new features and updates, and as always, I’m happy to dive a bit deeper into the new release to provide our readers with a wrap up of what’s new. Interestingly enough, and as reflected in the announcements surrounding this release, this release is all about Kibana. That’s not to say the other components in the stack were left out – to the contrary, and I will cover them all, don’t you worry.

Diving into Data with Honeycomb: "Codename: Drilldown" is in Beta!

This blog miniseries talks about how to think about doing data analysis the Honeycomb way. In this episode, we announce an exciting new feature, currently in beta. Honestly, we’re so excited to get this out the door, we haven’t settled on a final name so for now, we’re going with “Codename: Drilldown.”

Access Logs Analyzer - Analyzing Website Performance in No Time

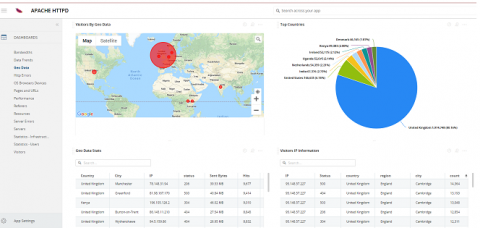
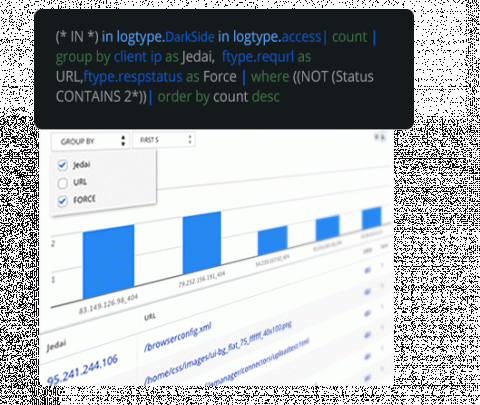
Website performance is a burning issue that matters to any IT professional who is responsible for the company’s website. Access logs performance analysis is used for analyzing all access logs for website performance: slow page load time, most frequent web pages and their errors, large web pages issues and more.