Operations | Monitoring | ITSM | DevOps | Cloud

Java

OpenTelemetry Java - Your Guide to Getting Started

OpenTelemetry (OTel), an open source project under the Cloud Native Computing Foundation (CNCF), is a collection of tools, APIs and SDKs for generating and collecting observability data (mainly trace, metrics and logs) from cloud-native applications. An industry-standard for distributed tracing and observability, OTel enables analyzing application health and performance to ensure production-readiness and support production monitoring.

How to install a Site24x7 APM Insight Java agent in a Spring Boot application

This video will walk you through the process of installing the Site24x7 APM Insight Java agent in a Spring Boot application. With the APM Insight Java agent installed, you can monitor your entire application, track every transaction that occurs, identify transaction errors, and optimize transactions before your end users are impacted.

How to install a Site24x7 APM Insight Java agent in a WildFly server 8.x and above-standalone setup

This video will walk you through the process of installing the Site24x7 APM Insight Java agent in a WildFly server (in a standalone setup). With the Site24x7 APM Insight Java agent installed, you can monitor your entire application. You'll be able to track every transaction that occurs, identify transaction errors, and optimize transactions to prevent your end users from becoming impacted.

Java application performance metrics 101

Since it first emerged, Java has had a phenomenal rise in usage and popularity. It’s ability to be robust and platform-independent has enabled it to rule the application development world by providing internet solutions for businesses across industries. Any organization that runs its mission-critical applications on Java shouldn’t be turning a blind eye towards understanding the importance of application performance monitoring.

5 common Java performance problems and how to avoid them using java monitoring tools

Java is one of the most widely used programming languages and it’s often used by back-end developers as a server-side language. It’s used by über-famous applications like Spotify, Twitter, Signal, and Cash App. Java has evolved immensely over the years and in addition to being easy to write, compile, and debug, it’s also more secure, portable, and effective in memory management compared to other languages.

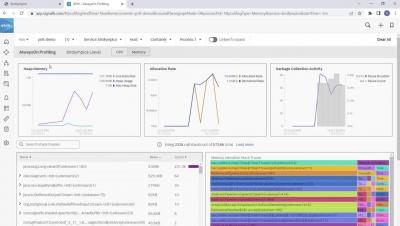
Memory Profiling for Java Applications, a Splunk APM Product Walkthrough

Splunk’s Product Manager Priit Potter walks you through how to identify memory bottlenecks in Java applications, in this detailed product walkthrough. See how Priit troubleshoots his own application, visualizes memory performance problems, and uses flame graphs to detail the line of code responsible for the problem, all with the help of Splunk Application Performance Monitoring.

Top 7 Java Performance Metrics to Monitor

Today, almost any metric you can think of can be tracked down and reported, as opposed to the past when the software was traditionally provided in boxes and its performance in production could not be predicted. The issues we are currently facing are not due to a lack of information, but rather to an abundance and scale of information. This becomes significantly more difficult to manage when dozens or even hundreds of servers are in use.

How to monitor JVM with OpenTelemetry

We are constantly working on contributing monitoring support for various sources, the latest in that line is support for JVM monitoring using the OpenTelemetry collector. If you are as excited as we are, take a look at the details of this support in OpenTelemetry’s repo. The best part is that this receiver works with any OpenTelemetry collector: including the OpenTelemetry Collector and observIQ’s distribution of the collector.

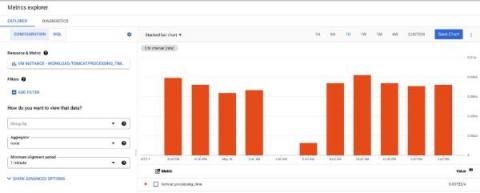
How to monitor Tomcat with OpenTelemetry

We are constantly working on contributing monitoring support for various sources, the latest in that line is support for Tomcat monitoring using the JMX Receiver in the OpenTelemetry collector. If you are as excited as we are, take a look at the details of this support in OpenTelemetry’s repo. You can utilize this receiver in conjunction with any OTel collector: including the OpenTelemetry Collector and observIQ’s distribution of the collector.

Java Debugging: Using Tracing To Debug Applications

Write enough programs, and you’ll agree that it’s impossible to write an exception-free program, at least in the first go. Java debugging is a major part of the coding process, and knowing how to debug your code efficiently can make or break your day. And in Java applications, understanding and leveraging stack traces can be the game-changer you need to ship your application quickly. This article will cover how to debug in Java and how Java stack traces simplify it.