Operations | Monitoring | ITSM | DevOps | Cloud

Amit explains AO

Most enterprises have observability tools. What they often lack is a shared view between application and infrastructure teams. When application performance degrades, finding the root cause can be slow because the data lives in separate silos. Virtana brings application observability and infrastructure intelligence together in a single platform, helping teams identify issues faster, collaborate more effectively, and shift from reactive troubleshooting to proactive operations.

How do you run AI when your data can't leave the network?

Highly classified environment. Strict compliance requirements. Data that can't leave the network. But still a real need for the competitive advantage AI delivers. Civo Director of Enterprise Cloud Solutions John Dietz addresses exactly that challenge and how Konstruct makes it possible to run Kubernetes, deploy your own models, and point Claude Code at your own internal private servers instead of public APIs.

Rebuilding the CircleCI CLI from scratch

Every developer knows the moment: CI goes red, and you face a choice. Open the browser and click through the web UI to the run, the workflow, the job, the step, the log line. Or stay in the terminal, where the fix is going to happen anyway. The new CircleCI CLI exists so you can stay. It’s 1.0, it’s in beta, and it’s a ground-up rewrite in Go, not an iteration on the CLI we’ve shipped for years.

StepbyStep Guide to Automating Alert Management for IT Ops

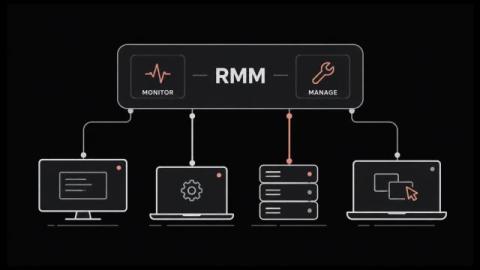
Your monitoring stack never sleeps. Datadog fires a spike, ServiceNow spins up a ticket, your RMM flags a failed backup, and every one of those signals competes for attention across email, dashboards, and chat channels. For IT Ops teams running on-call rotations, the volume itself becomes the problem. Alert fatigue sets in, critical notifications blend into the noise, and the one incident that matters at 3 a.m. gets buried under a hundred that don’t. The cost is real.

How to scale access control in Grafana Cloud

One of the primary reasons organizations adopt Grafana Cloud is to create a single pane of glass across the data they collect from self-hosted systems, cloud providers, and third-party platforms. Bringing those signals together enables richer correlations, reduces tool sprawl, and makes it easier for teams to understand what's happening across their environment. But as observability grows and becomes more centralized, access management becomes more important.

Runtime Aware PR Verifier | Lightrun

Lightrun's Or Golan demos the Runtime Aware PR Verifier, a new Lightrun product that simulates pull requests against live runtime behavior before you merge. Watch use Lightrun to simulate an AI-generated PR, identify the affected production flows, and uncover a hidden risk that static review would miss. Instead of only asking whether the code looks correct, Runtime Aware PR Verifier checks whether the change matches how your system actually behaves in production.

Cut CI Environment Setup Time in Half with Chunk sidecar Snapshots

Waiting minutes for CI feedback while you're building with AI agents kills your momentum. Chunk sidecars snapshots let you freeze your environment after setup, so every boot skips the install and starts from a cached state instead of scratch. In this tutorial, we demo how to set up Chunk sidecars, snapshot it, and boot from that snapshot. We also benchmark the difference: a cold sidecar start took 45 seconds. Booting from the snapshot took 12 seconds. That's 30+ seconds saved on every run, multiplied across every developer, branch, agent, and session.