Operations | Monitoring | ITSM | DevOps | Cloud

Tracing

The latest News and Information on Distributed Tracing and related technologies.

Making design decisions for ClickHouse as a core storage backend in Jaeger

ClickHouse database has been used as a remote storage server for Jaeger traces for quite some time, thanks to a gRPC storage plugin built by the community. Lately, we have decided to make ClickHouse one of the core storage backends for Jaeger, besides Cassandra and Elasticsearch. The first step for this integration was figuring out an optimal schema design. Also, since ClickHouse is designed for batch inserts, we also needed to consider how to support that in Jaeger.

Auto-Instrumenting Node.js with OpenTelemetry & Jaeger

Six months ago I attempted to get OpenTelemetry (OTEL) metrics working in JavaScript, and after a couple of days of getting absolutely no-where, I gave up. But here I am, back for more punishment... but this time I found success! In this article I demonstrate how to instrument a Node.js application for traces using OpenTelemetry and to export the resulting spans to Jaeger. For simplicity, I'm going to export directly to Jaeger (not via the OpenTelemetry Collector).

Understanding OpenTelemetry Spans in Detail

Debugging errors in distributed systems can be a challenging task, as it involves tracing the flow of operations across numerous microservices. This complexity often leads to difficulties in pinpointing the root cause of performance issues or errors. OpenTelemetry provides instrumentation libraries in most programming languages for tracing.

Grafana 10.1: TraceQL query results streaming

Tempo offers amazing performance, but there are still cases where TraceQL queries take a long time to return results. This could be due to a multitude of reasons from the complexity of the query, amount of choices stored, or the timeframe selected. See how to navigate your query results more quickly, with query results streaming, available as an experimental feature in Grafana version 10.1.

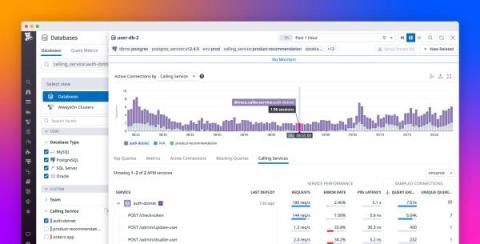
Seamlessly correlate DBM and APM telemetry to understand end-to-end query performance

When the services in your distributed application interact with a database, you need telemetry that gives you end-to-end visibility into query performance to troubleshoot application issues. But often there are obstacles: application developers don’t have visibility into the database or its infrastructure, and database administrators (DBAs) can’t attribute the database load to specific services.

Troubleshoot failed performance tests faster with Distributed Tracing in Grafana Cloud k6

Performance testing plays a critical role in application reliability. It enables developers and engineering teams to catch issues before they reach production or impact the end-user experience. Understanding performance test results and acting on them, however, has always been a challenge. This is due to the visibility gap between the black-box data from performance testing and the internal white-box data of the system being tested.

Native OpenTelemetry support in Elastic Observability

OpenTelemetry is more than just becoming the open ingestion standard for observability. As one of the major Cloud Native Computing Foundation (CNCF) projects, with as many commits as Kubernetes, it is gaining support from major ISVs and cloud providers delivering support for the framework. Many global companies from finance, insurance, tech, and other industries are starting to standardize on OpenTelemetry.

Best practices for instrumenting OpenTelemetry

OpenTelemetry (OTel) is steadily gaining broad industry adoption. As one of the major Cloud Native Computing Foundation (CNCF) projects, with as many commits as Kubernetes, it is gaining support from major ISVs and cloud providers delivering support for the framework. Many global companies from finance, insurance, tech, and other industries are starting to standardize on OpenTelemetry.