Operations | Monitoring | ITSM | DevOps | Cloud
opsdemon
Latest posts
Making data accessible with sound, a Grafana Labs Hackathon project by Kostas Pelelis
We learned from a visually impaired astronomer that it was possible to use sonification to understand astronomical spectra. So during a hackathon at Grafana Labs we decided to turn time series into audio, and add sound to our alerting systems too. Kostas Pelelis is a Software Engineer at Grafana Labs living in Greece.
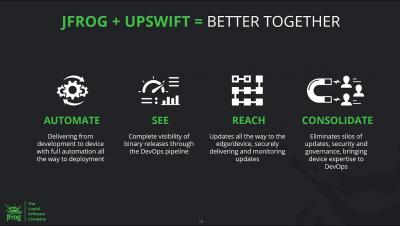
JFrog and Upswift: Bringing IoT Software Updates to DevOps Upswift Acquistion
JFrog has acquired Upswift to bring the world of connected devices into the DevOps pipeline! Managing fleets of devices and edge applications remotely - including over-the-air (OTA) updates, security, monitoring, controlling and more - has quickly become unwieldy for most companies, with growth of connected devices expected to reach 24 billion in 2026. But, most of today’s DevOps solutions are not optimized or built to deliver software updates to distributed edge and IoT environments.
Application dashboard for FluxCD
Now that you have implemented FluxCD, it's time to get those applications surfaced so your developers can manage and support them better.
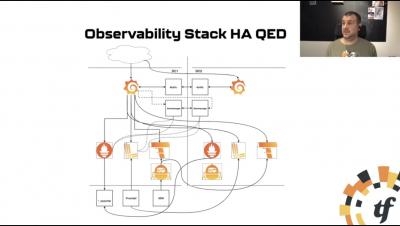
Bootstrapping a multi DC cloud native observability stack by Bram Vogelaar
An introduction to Observability and how to setup a highly available monitoring platform, across multiple data centers. During this talk we investigate how to config a monitoring setup across 2 DCs using Prometheus, Loki, Tempo, Alertmanager and Grafana. Bram Vogelaar spent the first part of his career as a Molecular Biologist, he then moved on to supporting his peers by building tools and platforms for them with a lot of Open Source technologies. He now works as a DevOps Cloud Engineer at The Factory.
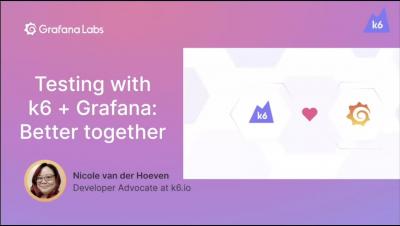
Testing with k6 + Grafana: Better together by Nicole van der Hoeven
k6 is one of the newest additions to the Grafana Labs family, but what exactly is it, and what does it have to do with Grafana? In this session, Nicole van der Hoeven will demonstrate how to use k6, how to integrate it with Grafana, and why k6 and Grafana are better together. Nicole van der Hoeven is a Developer Advocate at k6, living in the Netherlands.
Tales of A11y In Grafana OS: Introducing Pa11y CI into our pipeline by Alexa Vargas
We want to make Grafana accessible to everyone! In this talk, Alexa will share how Grafana recently introduced Pa11y CI into the Grafana Continuous Integration pipeline. The library supports our developers and contributors to highlight a11y issues. And more importantly, it acts as a gatekeeper, stopping new A11y issues from making it into the project. You will additionally hear about the alternatives that were considered and their challenges. This talk will have everything!
Using Thanos to gain a unified way to query over multiple clusters by Wiard van Rij
When using Thanos on top of Prometheus we can leverage this for a unified way in a single data source to query all our data across multiple clusters, servers and Prometheis. Wiard van Rij is an Engineer at Fullstaq helping people, teams, and organizations with various cloud-native challenges with a strong focus on Kubernetes and Observability. Wiard is a Thanos team member, open source enthusiast and has extra fun with security and hacking.
Self Healing Kubernetes at the edge
As developers and businesses are shifting their attention to the edge, everyone wants to build their own edge clusters and manage them. However, building a highly available edge cluster is not easy. Kubernetes simplifies container deployments by abstracting the resource management details from the users, allowing them to deploy using standard CLI or templates.
10 Best Linux Monitoring Tools and Software to Improve Server Performance [2021...
Linux is one of the most popular operating systems today, powering a large portion of the Internet. According to W3Techs, almost half of today’s top-ranked 1 million websites currently run on Linux systems. So, if you want your site—and the application(s) running on it—to be high-performing with lots of uptime, you need to ensure the availability and reliability of your Linux-based servers.
News Roundup October 8, 2021
On this day in 1906, barber-turned-inventor Karl Ludwig Nessler invented a machine that put permanent waves into hair in London, England.


