Mailchimp
Not subscribed to OpsMatters Newsletter


Over the last few years, our world has become increasingly digital, from streaming and shopping to work and health care. Customers want these digital experiences to be seamless. This has become a key priority for all businesses as well, as they depend on happy customers to drive sales and brand reputation. To ensure these seamless digital experiences, technology teams have doubled down on reliability, user experience, and building new features.
In my previous blog posts on test data management (TDM), I have discussed principles for continuous TDM and outlined how TDM for microservices-based applications differs from traditional applications. In this blog post, the first in a two-part series, I will combine both of these concepts to discuss key approaches for applying continuous TDM to microservices. In my second post, I’ll detail the key steps for applying continuous TDM in various phases of the delivery lifecycle.
For-Each is a new feature added to the DX Unified Infrastructure Management’s (DX UIM) Monitoring Configuration Service (MCS) that uses the device attributes with one or multiple values. MCS will loop through each value and create a profile for each one. If that attribute does not exist for a device, no profile will be created. Similarly, if a new value is added or removed from a device, MCS will revaluate and add or remove profiles.
One of the most challenging and rewarding things I do as a Principal Software Engineer in our Splunk Mobile division is ensuring our customers’ experience meets the quality and standards we promise to keep. My team and I are part of an on-call rotation that is committed to measuring and optimizing key Service Level Indicators (SLIs) using Splunk Real User Monitoring (RUM) and Splunk On-Call (iOS & Android) mobile apps.
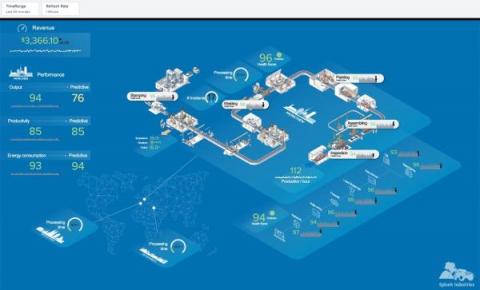
Why should only Dashboard Studio users get all the fun new features on Splunk Mobile and Splunk TV? To spread the cheer this new year, we brought the latest and greatest Mobile and TV features to IT Service Intelligence (ITSI) Glass Tables, so that you can view your ITSI data anywhere at any time!
In this roundup of the best dashboards powered by the Prometheus metrics monitoring system, we wanted to show you some of the best use cases for this ever-popular solution for time series metrics alerting.
All age groups demand speed, transparency, and a personalized approach when it comes to resolving customer issues. But new research from ServiceNow reveals a stark gap between how Australia’s oldest and youngest populations want issues addressed. Tech-savvy millennials want to communicate through chatbots, email, and direct messages. Baby boomers prefer to speak to an operator to resolve a problem. Other generations lie somewhere in between.
After the long process of designing and creating your website, your journey in its development has only started. Now you need to move forward, watching, analyzing and fixing any problems that may occur (and probably will) that could ruin your customer’s website experience. But how can you learn if there’s anything that’s wrong with your website? How can you measure user experience and learn where improvements are needed? Well, we have got an answer for you!
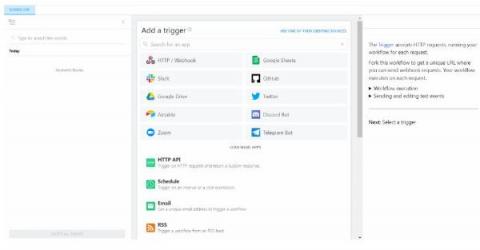
A big part of modern software development involves working with APIs. While using 3rd party services can speed up development, moving data around and gluing things together can be pretty dull. Luckily, there are a growing number of tools that help deal with the boring stuff so you can focus on more interesting things. One of these tools is Pipedream.
With our February update, it is now possible to centrally configure how Signls should be notified. And of course, each team can have a different configuration of their notification preferences. This also includes response and escalation settings. In addition, it is now possible to set different notification patterns per day and time of the day, e.g. to notify via different channels at night than during office hours.