Mailchimp
Not subscribed to OpsMatters Newsletter


Manufacturers were already reexamining how they use technology when COVID-19 hit and significantly accelerated that need. Some transformed and were able to pivot quickly, but others are still grappling with challenges in their supply chain and demand fluctuations. There will be more changes, including unexpected ones, and manufacturing operations must adapt quickly. Digital transformation has some real advantages in the industry.
ZE PowerGroup Inc. is a British Columbia-based software company. It offers ZEMA, an award-winning data management, analytics, and integration platform. Although ZEMA was created in-house, the developers at ZE were never successful at measuring the performance of the application during the initial years. They tried a few third-party tools, but measuring the actual application performance continued to be a dilemma until they evaluated ManageEngine’s Applications Manager.
In this tutorial, we will go through a working example of a Ruby application auto-instrumented with OpenTelemetry. To keep things simple, we will create a basic “Hello World” application, instrument it with OpenTelemetry’s Ruby client library to generate trace data and send it to an OpenTelemetry Collector. The Collector will then export the trace data to an external distributed tracing analytics tool of our choice.
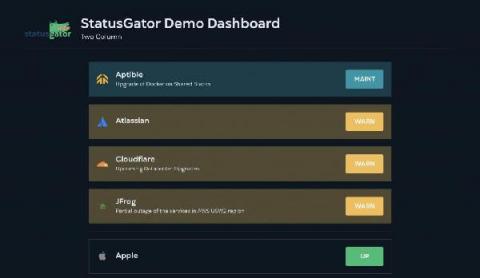
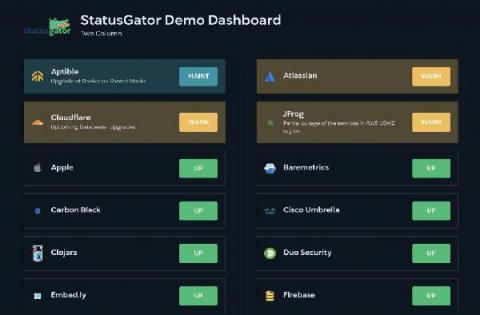
Since we first launched our customizable, brandable, public status dashboards, customers have been asking us for a dark mode version. We’re excited to announce dark mode has arrived! StatusGator is the premier status page aggregator that collects the status of all the services you depend on and organizes them into a handy public dashboard you can send to your team, users, or stakeholders. And now it won’t blind you with it’s bright white background!
Many customers have requested that StatusGator’s customizable, brandable, aggregated status dashboards automatically refresh. Well your auto refreshing dreams have just come true because StatusGator status dashboards now update every 5 minutes automatically! Each dashboard will now refresh every 300 seconds, otherwise known as 5 minutes, automatically. And, of course, you can still refresh your browser yourself to get the latest content.
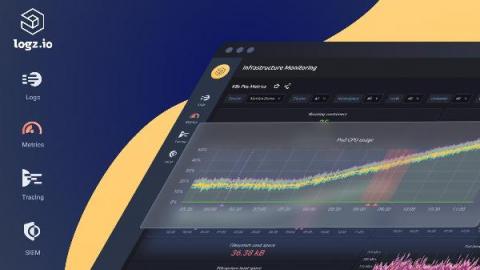
Back in June, we announced the Public Beta for Logz.io’s New Lookz – which is a new UI that completely changes the way users navigate across Logz.io products and features. The Public Beta gave users the option to toggle between the old and new UIs to see which one they liked better. And the answer from our users was as clear as it could be.