Operations | Monitoring | ITSM | DevOps | Cloud

Monitoring AWS Analytics

Amazon Web Services (AWS) products are countless, and at LogicMonitor, we are working tirelessly to bring monitoring support to as many of them as possible. With so many products and tools already on your plate, we want to make sure that monitoring is not a hassle, but rather a trusted companion. Here, we will focus on the analytics section of AWS and provide some tips on how to utilize the data collected from AWS Athena and Glue.
Integrating eG Enterprise with Microsoft Power BI for Application and Infrastructure Performance Analytics

Microsoft Power BI is a business analytics solution providing interactive visualizations and business intelligence capabilities from data and provides an interface that is simple enough for admins to create their own reports and dashboards. Data inputs to Power BI can come from multiple sources – Excel worksheets, CSV files, database tables, log files, the web, etc. It then employs smart visualizations and built-in AI technologies on that data to turn it into interactive insights.

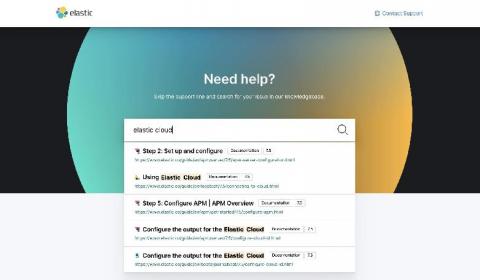
Creating modern customer service experiences with Elastic Enterprise Search

Let’s be honest. No one wakes up in the morning thinking of reasons to contact customer support. It’s tedious, onerous, and can eat into your evening Netflix time. Thankfully, most brands realize that customer experiences drive brand loyalty and repeat purchases.

Glitch List: April 2020

Even though most of us have spent this month working from home or furloughed due to COVID-19, glitches certainly haven’t been taking a break. We’re still relying on intricate software systems to keep the world moving, and we have little ability to maintain them in person. What’s more, changing usage patterns have stressed global networks in ways that are hard to anticipate. As a result, we find ourselves in a perfect storm for technical outages.

Store and Show Raw Log Lines

LogDNA is adding the ability to store and view raw lines, allowing customers to debug with logs in their unaltered form. If you’ve ever looked at your logs and noticed that the timestamp was different than what you expected, it is usually due to a long latency between the event and processing time of the logs. Depending on the size of the latency, we may update the log timestamp to order them accurately and to provide a cleaner and more intuitive search experience.

Virtual Time Series Meetup - March 2020

Talk 1: Prophet for forecasts with InfluxDB Anais Dotis-Georgiou | Developer Advocate, InfluxData Abstract Data collection is only half of the battle. The other half is being able to easily perform data analysis. FB Prophet aims to make time series forecasting simple and fast. We’ll learn how to make a univariate time series prediction with Prophet and InfluxDB.