Operations | Monitoring | ITSM | DevOps | Cloud

APM

The latest News and Information on Application Performance Monitoring and related technologies.

From On-call to Non-call: Resolving Incidents Before They Even Happen

Artificial intelligence has captured the attention of the world, with tools like ChatGPT and large language models (LLMs) driving the conversation. But you don’t need to wait for the future or new features powered by LLMs to start working smarter—the tech industry has been investing in intelligent, automated tools for years and they’re ready for production now. In this talk, you’ll learn how the engineering teams at Toyota Connected use tools like Datadog Watchdog, Anomaly Detection, and Workflows to make our lives easier and keep our platform stable.

From Solution to Startup

Before Datadog was a widely adopted SaaS platform, it was a tool developed to solve our founders’ own monitoring needs. As technology-oriented people, we often build solutions for our own problems, then discover those problems are widespread. But how do you know when your solution should be something more? In this panel session, we’ll talk with tech startup founders to hear their stories and advice for turning tools into businesses.

Deliver exceptional digital experiences with Cisco Cloud Native Application Observability

From the application layer down to your Kubernetes® infrastructure, Cisco Cloud Native Application Observability delivers cross-domain visibility with correlated MELT data and AI/ML-driven insights to simplify the complexity of observing the performance of modern applications, multi-cloud Kubernetes, and hybrid cloud infrastructure.

A guide to single-page application performance

Many of us have heard single-page applications (SPAs) hailed as the future of web applications. Proponents of SPAs point to increased code reusability and development velocity, and the advantage SPAs can give when it comes to delivering a fast and seamless user experience. Massive sites like Facebook, AirBnB and Trello are all built as SPAs. On the flipside, monitoring SPAs for performance is pretty challenging.

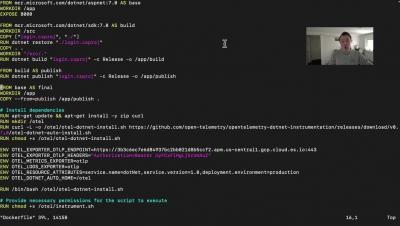
Elastic APM - Automatic .NET Instrumentation with OpenTelemetry

Check out this YouTube video on Elastic Application Performance Monitoring (APM) and its integration with OpenTelemetry for.NET! In this informative and practical tutorial, we delve into the world of APM and demonstrate how to effectively instrument your.NET applications using OpenTelemetry with Elastic APM. Additional Resources: Connect with us on social media.

What is Garbage Collection in Java: Detailed Guide

The Garbage Collection (GC) feature in the Java Virtual Machine (JVM) is truly remarkable. It automatically identifies and cleans up unused Java objects without burdening developers with manual allocation and deallocation of memory. As an SRE or Java Administrator you need a strong understanding of the Java Garbage Collection mechanism to ensure optimal performance and stability of your Java applications.

What Is APM and How Can It Help Your Services/Applications?

APM is one of those buzzwords that is slowly becoming a necessity. Most people are still unsure what APM means and how it can help their services. But what is it? What does it stand for? And how can it help your services or digital products? This blog will answer your questions—and more.

Dive Deeper into your Trace and Logs Data with Query Builder - Community Call Aug 1

This week for our community call we show our new Trace explorer with a GUI for creating queries, custom dashboards, and alert thresholds. Great participation from the community, thank you so much for participating. SigNoz - Monitor your applications and troubleshoot problems in your deployed applications, an open-source alternative to DataDog, New Relic, etc. Backed by Y Combinator. SigNoz helps developers monitor applications and troubleshoot problems in their deployed applications. SigNoz uses distributed tracing to gain visibility into your software stack.

Monitor gRPC calls with OpenTelemetry - explained with a Golang example

gRPC (Google Remote Procedure Call) is a high-performance, open-source universal RPC framework that Google developed to achieve high-speed communication between microservices. gRPC has Protobuf (protocol buffers) by default which would format or serialize the messages to a specific format that will be highly packed, highly efficient data. By its virtue of being a lightweight RPC, gRPC is suited for many use-cases. gRPC can be considered a successor to RPC, which is light in weight.