The latest News and Information on DevOps, CI/CD, Automation and related technologies.
In the heat of an incident, having a clear and shared understanding of what’s going on is absolutely crucial to effective response. But often what actually happens is that people involved in incidents build their own picture and narrative of the event, shaped by their own expertise, their past experiences, and what they’re seeing and hearing as the incident develops. The pictures and perspective people build is often referred to as a mental model.
To understand why Graphite metrics delay occurs, we must first know what Graphite is. Graphite is an open-source tool used to track the performance of websites, applications, and network servers. It makes it simple to monitor, store, retrieve, and visualize numeric time-series data. While Graphite does make it easier to render graphs on-demand, the struggle of dealing with large amounts of data with minimum delay is real.
Attention, all tech enthusiasts! We are thrilled to announce that ManageEngine has once again been positioned as an Overall Leader for UEM in the KuppingerCole Leadership Compass. This marks the second consecutive time we have achieved this recognition. We have been acknowledged as leaders in all three leadership categories: Product Leadership, Innovative Leadership, and Market Leadership.
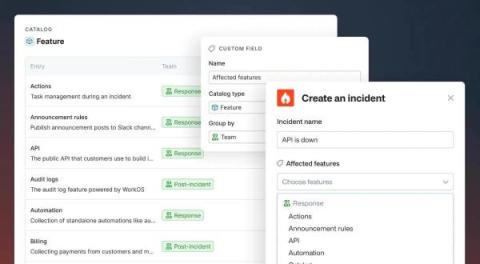
As you may have already seen, we’ve recently released a Catalog feature at incident.io. While designing and building it, we took an approach that’s a tangible departure from a traditional service catalog. Here’s how we’re different, and why.
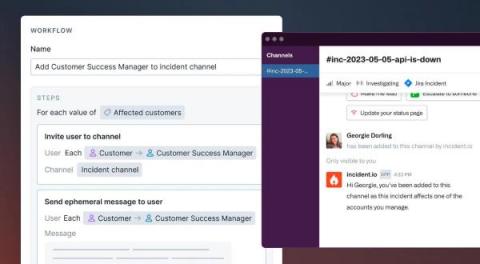
We recently introduced Catalog: the connected map of everything in your organization. In the process of building Catalog as a feature, we’ve also been building out the content of our own catalog. We'd flipped on the feature flag to give ourselves early access, and as we went along, we used this to test out the various features that Catalog powers.