Operations | Monitoring | ITSM | DevOps | Cloud

The latest News and Information on Log Management, Log Analytics and related technologies.

.NET Logging: Best Practices for your .NET Application

Logging is a key requirement of any production application. .NET Core offers support for outputting logs from your application. It delivers this capability through a middleware approach that makes use of the modular library design. Some of these libraries are already built and supported by Microsoft and can be installed via the NuGet package manager, but a third party or even custom extensions can also be used for your .NET logging.

Exclaimer: Shortening the lengths of incidents with Datadog

Hear how Matt Hodge from Exclaimer leverages Datadog Log Management to migrate away from a homegrown solution and find one platform to manage dev and ops logs. Through deep integrations with Microsoft Azure, Exclaimer is able to gain rapid visibility into their entire Azure-based infrastructure as well.

Announcing the Elastic Contributor Program

Open source contributions are foundational to Elastic — from Elasticsearch’s Apache Lucene core to the addition of open source Logstash and Kibana to form the Elastic Stack you’ve come to know and love. Over the years, the Elastic community has created over 90 Beats, shared use case tutorials like those from Volvo, T-Mobile, and Microsoft, and presented at hundreds upon hundreds of meetups.

Kubernetes Logging and Monitoring: What Kubernetes Can and Can't Do Natively

Kubernetes is a container orchestration tool, but its functionality extends far beyond just orchestrating containers in a narrow sense. It offers a range of additional features that—to a limited extent—address needs such as load balancing, access control, security policy enforcement, and even logging and monitoring. Indeed, Kubernetes’s broad functionality has led some folks to call it an “operating system” in its own right.

Using Private Threat Intelligence Feeds on Hidden Security Attacks with Logz.io

Oftentimes, security attacks that were clearly recorded in logs go unnoticed. They are obscured by a large sea of log data created by most modern cloud environments. In some cases, like during a DDoS attack, there will be a huge spike in logs so it will be very clear what happened. In other situations, just a few logs will document the attack. Finding these logs can be like finding a needle in a hay stack. But if you know what to looks for, it doesn’t need to be so hard to spot these attacks.

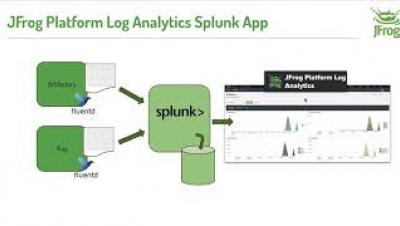
JFrog Platform Log Analytics Splunk App

The Splunk App for JFrog Platform Log Analytics processes extracted log data for the JFrog Platform, the universal, hybrid end-to-end DevOps platform. The app provides a set of operations diagnostic dashboard views for JFrog Artifactory and JFrog Xray error tracking. Learn how the Splunk app works, with some demonstration of its use.

Extended retention for custom and Prometheus metrics in Cloud Monitoring

Metrics help you understand how your business and applications are performing. Longer metric retention enables quarter-over-quarter or year-over-year analysis and reporting, forecasting seasonal trends, retention for compliance, and much more. We recently announced the general availability (GA) of extended metric retention for custom and Prometheus metrics in Cloud Monitoring, increasing retention from 6 weeks to 24 months. Extended retention for custom and Prometheus metrics is enabled by default.

Configuring a SAML realm for role-based access control in ECE

Elastic Cloud Enterprise (ECE) makes it easy to manage your Elastic Stack deployments, just like role-based access control (RBAC) makes it easy to manage your users. Combining the two can really make an administrator's life much simpler. The intent of this blog post is to provide instructions for configuring a SAML realm for RBAC in ECE environments where Auth0 is used as an identity provider (IdP).

MLOps - Logs, Metrics and Traces to improve your Machine Learning Systems

Once you’ve reached the point where you want to deploy your machine learning models to production, you will eventually need to monitor operations and performance. You might also want to receive alerts in case of any unexpected behavior or inconsistencies with your model or your data quality. This is where you most likely start learning about various aspects of Machine Learning Operations (MLOps).