The latest News and Information on Monitoring for Websites, Applications, APIs, Infrastructure, and other technologies.
Giraffe is InfluxData’s graphing library, built to use and graph the data coming from InfluxData’s time series database, InfluxDB. Yes, there are other graphing libraries available; but ours is the only one purpose-built to graph line protocol without having to convert it. Plus, we have lots of great features, like legends and colorization, without much configuration. So, how to get started?
Microsoft 365, formerly known as Office 365, is a suite of cloud-based productivity and communication services that is used by more than one million companies worldwide. The applications included in the suite are critical to the daily workflows of subscribers and therefore require careful monitoring in order to minimize the effects of downtime and ensure optimal usage.
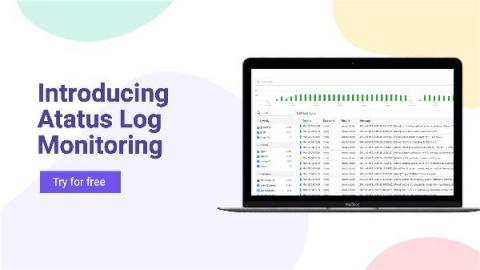
Log Monitoring is a crucial step in ensuring to know what’s happening in all your servers from a single location. Did you know Log Monitoring tools are implemented by the strategy called “defense-in-depth”? Boom!!! That’s where the log monitoring concept developed, and now we have many log monitoring tools in the market. Issues that users face in the log monitoring tool: We considered all the above points while we designed our tool.
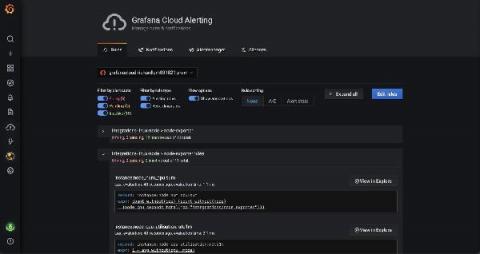
As the product manager for Grafana Cloud, I am constantly following the progress of all the new features that our engineering teams are working on, from early ideation to release. We’re always excited to share updates with the community, so you can all try them out and let us know what you think. So each month, I’ll be rounding up the latest Grafana Cloud features and improvements on the blog.