The latest News and Information on DevOps, CI/CD, Automation and related technologies.
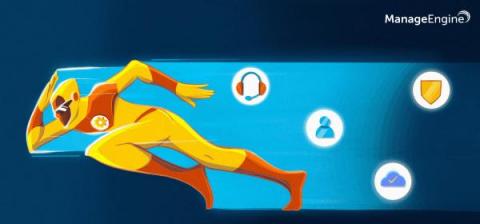
Five worthy reads is a regular column on five noteworthy items we’ve discovered while researching trending and timeless topics. In this edition, we’ll learn what hyperautomation is all about, why it is a growing trend, and much more. Illustrated by Derrick Deepak Roy Digital transformation has been accelerating at a pace so fast that organizations all over the globe are making frantic changes to their infrastructures to keep up.
Software applications consist of interconnected systems - each providing a specialized service towards the common goal of meeting a business need. As with any network, an efficient data exchange mechanism is key to its functionality, effectiveness, and responsiveness. In the past, data exchange was performed using polling requests. At regular intervals, a system would make a request to get the latest information or find out if there is an update to deal with.
Data visualization is the process of translating large data sets and metrics into charts, graphs, and other visuals. The resulting visual representation of data makes it easier to identify and share real-time trends, outliers, and new insights about the information represented in the data. Using CircleCI webhooks, we can gather data on workflow and job events. In this tutorial, I will lead you through the steps to create a React-based dashboard to visualize this data.
A summary of the Log4j vulnerability, and key takeaways for SREs.
Modern-day applications aim to cover a wide range of users’ needs in a flexible and scalable manner. The software development landscape is moving at a fast pace, and the competition is so fierce that a business simply can’t afford to offer a low-quality product. Thorough testing of both functional and non-functional aspects of a software application has become an essential step in the software development process. It ensures that users get the best version of your product.