The latest News and Information on Monitoring for Websites, Applications, APIs, Infrastructure, and other technologies.
The Internet of Things (IoT) has quickly become a huge part of how people live, communicate and do business. All kinds of everyday things make up this network – fridges, kettles, light switches – you name it. If it’s connected to WiFi, it’s part of the Internet of Things. IoT raises significant challenges that could stand in your way of fully realizing its potential benefits.
When a site is down, Oh Dear sends a notification every hour. Since last year, our notifications can be snoozed for a fixed amount of time (5 minutes, 1 hour, 4 hours, one day). In the evenings and weekends, you might not want to receive repeated notifications. That's why we've added a nice human touch: all notifications can now be snoozed until the start of the next workday. You can choose this new options in the snooze settings of a check.
Getting visibility into your application is crucial when running your code in production. What do we mean by visibility? Primarily things like application performance via metrics, application health, and availability, its logs should you need to troubleshoot it, or its traces if you need to figure out what makes it slow and how to make it faster. Metrics give you information about the performance of each of the elements of your infrastructure.
Successful businesses don’t sort data — they shape it. Discover, Sentry’s query builder, gives form to your event data so you can measure performance and trace issues across all your projects. Here’s how.
We are living in a time where a difference of a mere couple of seconds can make you lose your business to another company with a faster, more easily accessible web application. In such a highly competitive space, it is important to squeeze out the maximum amount of performance from your application’s software stack and hardware infrastructure.
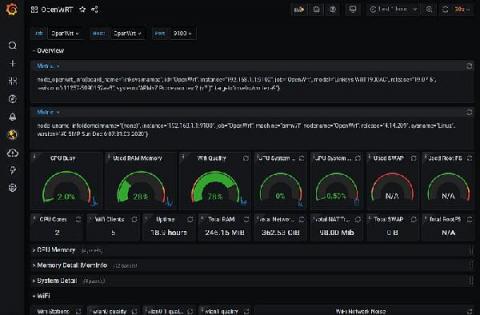
I’ve been an open source fan and user for many, many years, going back to before we defined the term “open source” and we called it “free software.” Whenever and wherever possible I prefer to have control over the software I run on my devices. Case in point: My internet router runs OpenWrt, which is a free/open source Linux operating system designed to replace the software provided by the router’s manufacturer.
Before getting started on how to read Graphite metrics, let us first dive into understanding what Grafana is all about. In a nutshell, Grafana is an open source analytics and monitoring solution, developed and supported by Grafana Labs. It allows you to query, display graphs and set alerts on your time-series metrics no matter where the data is stored.
As an industry-leading provider of the most comprehensive Microsoft 365 monitoring solution, Martello is in a class all its own; our digital experience monitoring solution features key capabilities that help IT teams identify when and where cloud application performance issues are happening and how to best mitigate the impact.