Traditionally an APM tool, Scout has expanded its service offerings to now include error monitoring of Python web applications for more cohesive and actionable observability insights within a single platform. This new feature supports an overall better user experience by eliminating the need for multiple web-application monitoring services; Scout APM with Scout Error Monitoring offers performance and error insight and alerting within a single, integrated dashboard.
We just announced the creation of a new RemoteWrite SDK to support custom metrics from applications using several different languages. This tutorial will give a quick rundown of how to use the Python SDK. Using these integrations, Prometheus users can send metrics directly to Logz.io using the RemoteWrite protocol without sending them to Prometheus first. Each SDK, while for a separate language, is each capable of working with frameworks like Thanos, Cortex, and of course M3DB.
We’re proud to announce the creation of a new RemoteWrite SDK to support custom metrics from applications using Golang (Go), Python, and Java, with many more on the way. Each SDK will have automatic, continuous deployment of updates. Using these integrations, Prometheus users can send metrics directly to Logz.io using the RemoteWrite protocol without sending them to Prometheus first.
A deep dive into boto3 and how AWS built it. AWS defines boto3 as a Python Software Development Kit to create, configure, and manage AWS services. In this article, we’ll look at how boto3 works and how it can help us interact with various AWS services.
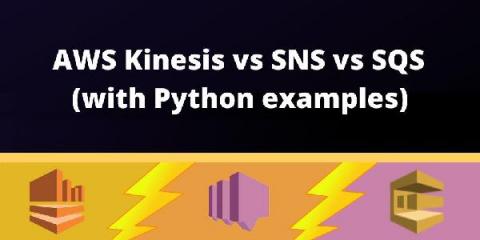
How to choose a decoupling service that suits your use case? In this article we’ll take you though some comparisons between AWS services – Kinesis vs SNS vs SQS – that allow you to decouple sending and receiving data. We’ll show you examples using Python to help you choose a decoupling service that suits your use case. Decoupling offers a myriad of advantages, but choosing the right tool for the job may be challenging.
Daniel is a Site Reliability Engineer at k6.io. He’s especially interested in observability, distributed systems, and open source. During his free time, he helps maintain Grafana Tempo, an easy-to-use, high-scale distributed tracing backend. Distributed tracing is a way to track the path of requests through the application. It’s especially useful when you’re working on a microservice architecture.
In our last blog, we introduced OpenTelemetry Python v1.0.0 and walked you through instrumenting a Python application and install both the OpenTelemetry API and SDK.
Performance optimization is a basic need for software development. When it comes to optimizing app performance, tracking frequency, maintaining production, or perpetuation method calls, profilers play a vital role. Learn why Python cProfile is a recommended profiling interface and how it enhances your software performance.