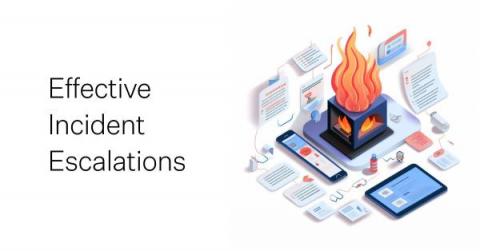
In the ever-evolving digital landscape, every organization must confront its fair share of incidents. Regardless of the sector or size, one common thread weaves through them all: the need for effective incident management. A crucial part of this management is incident escalation, a topic on which we've had many discussions with various companies.
The incident-io/core application uses a mixture of environment variables, config files and secrets stored in Google Secret Manager to configure the app. This is a reference guide to all the parts that make up this flow.
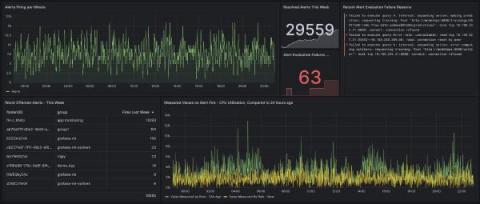
The Prometheus alerting model is a flexible tool in every observability toolkit. When enhanced with Grafana data sources, you can easily alert on any data, anywhere it might live, using the battle-tested label semantics and alerting state machine that Prometheus defines. Often, engineers want to see patterns in their alerts over time, in order to observe trends, make predictions, and even debug alerts that might be firing too often.
We are thrilled to announce that, for the third consecutive year, Datadog has been named a Leader in the 2023 Gartner® Magic Quadrant™ for APM and Observability. We believe that this placement reflects Datadog’s continued commitment to understanding our customers’ most complex challenges and building products and services that give them the visibility they need into their applications.
In the rapidly evolving world of cloud computing, caching solutions have become an essential tool for enhancing application performance, reducing latency, and providing a seamless user experience. One such robust and reliable solution is offered by Microsoft Azure, known as Azure Redis Cache. This advanced caching solution is designed to accelerate the performance of your applications by allowing you to store and retrieve data from fast, managed, in-memory caches.