Operations | Monitoring | ITSM | DevOps | Cloud
Logging
The latest News and Information on Log Management, Log Analytics and related technologies.
The concise guide to labels in Loki
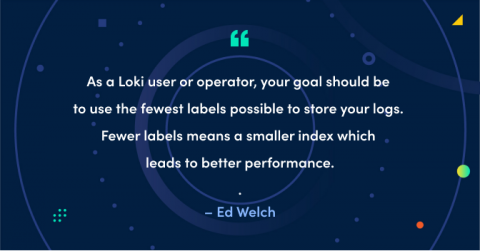
A few months ago, I wrote an in-depth article describing how labels work in Loki. Here, I’m consolidating that information into a more digestible “cheat sheet.” There are some big differences in how Loki works compared to other logging systems which require a different way of thinking. This is my attempt to convey those differences as well as map out our thought process behind them. As a Loki user or operator, your goal should be to use the fewest labels possible to store your logs.
Extended retention for custom and Prometheus metrics in Cloud Monitoring
Metrics help you understand how your business and applications are performing. Longer metric retention enables quarter-over-quarter or year-over-year analysis and reporting, forecasting seasonal trends, retention for compliance, and much more. We recently announced the general availability (GA) of extended metric retention for custom and Prometheus metrics in Cloud Monitoring, increasing retention from 6 weeks to 24 months. Extended retention for custom and Prometheus metrics is enabled by default.
Configuring a SAML realm for role-based access control in ECE
Elastic Cloud Enterprise (ECE) makes it easy to manage your Elastic Stack deployments, just like role-based access control (RBAC) makes it easy to manage your users. Combining the two can really make an administrator's life much simpler. The intent of this blog post is to provide instructions for configuring a SAML realm for RBAC in ECE environments where Auth0 is used as an identity provider (IdP).
MLOps - Logs, Metrics and Traces to improve your Machine Learning Systems
Once you’ve reached the point where you want to deploy your machine learning models to production, you will eventually need to monitor operations and performance. You might also want to receive alerts in case of any unexpected behavior or inconsistencies with your model or your data quality. This is where you most likely start learning about various aspects of Machine Learning Operations (MLOps).
Logging Java Apps with ELK and Logz.io
Java is a well-established object-oriented programming language that epitomizes cross-platform software development and helped to popularize the “write once, run anywhere” (WORA) concept. Java runs on billions of devices worldwide and powers a huge range of important software, such as the popular Android operating system and Elasticsearch. In this tutorial, we will go over how to manage Java logs with the ELK Stack and Logz.io.
Slow and steady: How to build custom grok patterns incrementally
In our blog post on structuring Elasticsearch data with grok on ingest for faster analytics, we took a look at how to structure unstructured data on ingest (schema on write) to make sure your analytics run at near real time. Speed like that can help take your observability use cases to the next level. In this article, we’re going to build on what we learned by incrementally creating a new grok pattern from scratch!
Open Source Grafana Tutorial: Getting Started
Open source grafana is one of the most popular OSS UI for metrics and infrastructure monitoring today. Capable of ingesting metrics from the most popular time series databases, it’s an indispensable tool in modern DevOps. This OSS grafana tutorial will go over installation, configuration, queries, and initial metrics shipping. Open source grafana is the equivalent of what Kibana is for logs (for more, see Grafana vs. Kibana).
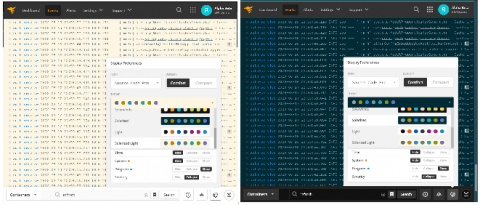
Two New Color Themes in the Event Viewer Display Options
Alerting and anomaly detection for uptime and reliability
Being able to easily monitor the health of all your sites and services from multiple global locations is a powerful tool for site reliability. However, no one wants to sit and stare at a status dashboard all day. Naturally, teams want to be alerted when there is an issue. We can do that with alerting in Kibana. And when coupled with Elastic machine learning, alerts can be automatically generated from anomalies that are automatically detected. That’s the power of Elastic Observability.


