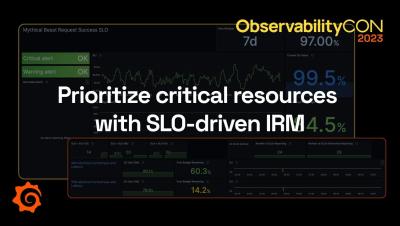
The latest News and Information on Monitoring for Websites, Applications, APIs, Infrastructure, and other technologies.
Understanding your AWS S3 billing is crucial to effectively manage and reduce your costs. Charges in AWS S3 are primarily based on three factors: the amount of data you store, the number of requests you make, and data transfer fees. Storage costs are calculated per gigabyte (GB) stored, which are tiered depending on the total size of your data. Requests costs are incurred with each put, get, or list operation on your objects, with prices varying based on the type of request.
As customers scale to thousands of hosts and deploy increasingly complex applications, it can be difficult to ensure that every host is configured to give you the visibility you need to monitor your infrastructure and applications. To ensure visibility across a growing number of hosts, you need to know that your observability strategy is implemented uniformly across your entire fleet of Datadog Agents installed on these hosts.
As organizations adopt Kubernetes, they face gaps in security, reliability, and observability such as unencrypted communication, lack of multi-cluster support, and missing reliability features like circuit breaking. Buoyant Cloud is the dashboarding and automated monitoring component of Buoyant Enterprise for Linkerd, which helps organizations secure and monitor communication between Kubernetes workloads.
Table of contents Frankly, end-to-end testing and synthetic monitoring are challenging in today’s JavaScript-heavy world. There’s so much asynchronous JavaScript code running in modern applications that getting tests stable can be a real headscratcher. That’s why many teams rely on testing mission-critical features and treat “testing the rest” as a nice to have. It’s a typical cost-effort decision.
Observability isn’t just about watching for errors or monitoring for basic health signals. Instead, it goes deeper so you can understand the “why” behind the behaviors within your system. CI/CD observability plays a key part in that. It’s about gaining an in-depth view of the entire pipeline of your continuous integration and deployment systems — looking at every code check-in, every test, every build, and every deployment.
Unlocking the full potential of observability and tracing in modern software ecosystems has become imperative for businesses striving to deliver improved reliability and user experience. In this comprehensive roundup, we will dive into the world of Jaeger-incorporated observability and tracing dashboards, offering a curated selection of the best use cases that empower DevOps teams, engineers, and developers to gain unparalleled insights into the inner workings of their applications.