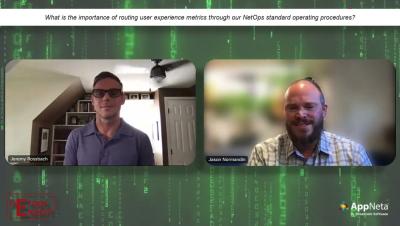
The latest News and Information on Monitoring for Websites, Applications, APIs, Infrastructure, and other technologies.
As a DevOps engineer or SRE, you are often faced with investigating complex problems — mysterious application performance issues that happen intermittently or to only certain portions of your application traffic — that impact your end users and potentially your company’s financial targets. Sifting through hundreds or even thousands of transactions and spans can be a lot of tedious, manual, and time consuming investigative work.
Written by Andrew Puch and Brian Langbecker You use NGINX as a proxy for your application, and you want to leverage your favorite features in Honeycomb to help make sense of the traffic data. Have no fear: Honeycomb is more than capable and ready to help! Things you will need: Before you start with the instructions, let’s discuss a lightweight tool called Honeytail. This utility will tail log files, parse the various formats, and send the data to Honeycomb.
This article was originally published in The New Stack and is reposted here with permission. Hundreds of billions of sensors produce vast amounts of time series data every day. The sheer volume of data that companies collect makes it challenging to analyze and glean insights. Machine learning drastically accelerates time series data analysis so that companies can understand and act on their time series data to drive significant innovation and improvements.
Akka’s license change has surprised many of us, but it didn’t come out of nowhere. Lightbend recently announced that Akka will be transitioning from an “Open Source” license to a “Source available” license called BSL 1.1. Let’s unpack this to understand what it all means.
An essential aspect of operating any application is the ability to observe the health and performance of that application and of the underlying infrastructure to quickly resolve issues as they arise. Google Kubernetes Engine (GKE) already provides audit logs, operational logs, and metrics along with out-of-the-box dashboards and automatic error reporting to facilitate running reliable applications at scale.
You may be asking yourself: What exactly is Podman? Podman is short for Pod Manager and is a daemonless, open source container engine alternative to Docker that allows for rootless containers. Podman is available for Linux, Mac, and Windows operating systems. It only requires a simple and easy install on RPM-based Linuxes, such as Red Hat Enterprise Linux, CentOS, Rocky, or AlmaLinux.
This series of six blogs outlines the basics of the Observability Maturity Model. Use it to identify where you are on the observability path, understand the road ahead and provide guidance to help you find your way.