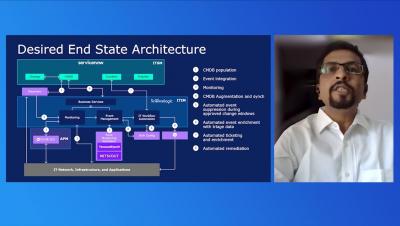
Operations | Monitoring | ITSM | DevOps | Cloud

The latest News and Information on Monitoring for Websites, Applications, APIs, Infrastructure, and other technologies.

Why Dashboards Are Not Enough to Proactively Monitor Your Business

How much is your company losing by reacting to problems after they’ve had a negative impact on your bottom line? How many customers churn in the time it takes you to notice complaints to your call center? Proactive business monitoring allows you to detect incidents before they have a negative impact on your company’s revenue and reputation.

Unify Visibility Across Your Monitoring Tools with DX Operational Intelligence

For today’s businesses, there’s a premium on delivering innovative user experiences. As a result, stakes continue to grow for the teams in charge of supporting new digital experiences. To successfully implement modern delivery chains, IT operations need to establish comprehensive coverage that delivers unified visibility of the entire enterprise ecosystem. They need observability that spans from mobile applications to networks and mainframes.

Splunk Workload Pricing For the Win!

We at Splunk know that data drives better decisions. We see this with customers, and we live it every day in our own operations within Splunk. Running large cloud services across multiple cloud providers, we have to manage data policies and data processing needs against an increasing set of use cases, as well as the backdrop of regulatory, privacy and security frameworks.

Using pre-built Monitors to proactively monitor your application infrastructure

SREs, developers and DevOps staff for mission-critical modern apps know being notified in real-time when or before critical conditions occur can make a massive difference in end-user digital experiences and in meeting a 99.99% availability objective.

The Spike Protection Bundle with Index Rate Alerting

For DevOps teams that want to accelerate release velocity and improve reliability, logs can unlock the insights you need to move faster. But for managers and budget owners, logging can be an unpredictable pain. Trying to estimate logging spend, especially with the adoption of microservices and container-based architecture, seems like an impossible task.

Announcing LogDNA Agent 3.2 GA: Take Control of Your Logs

The LogDNA Agent is a powerful way for developers and SREs to aggregate logs from their many applications and services into an easy-to-use web interface. With only 3 kubectl commands, the installation process is quick and simple to complete for any number of connected systems. To help control the logs that are stored and surfaced in the LogDNA web interface, users can set Exclusion Rules, which enables the exclusion of certain queries, hosts, and tags directly from the UI.