Operations | Monitoring | ITSM | DevOps | Cloud

The latest News and Information on Monitoring for Websites, Applications, APIs, Infrastructure, and other technologies.

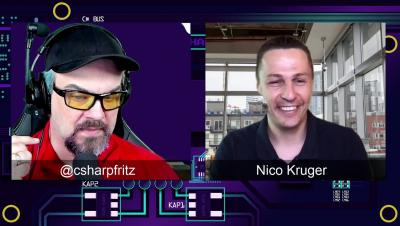
Error logging, tracing, and improving developer workflow with Jeffrey T. Fritz

Today Nico joined Jeffrey T. Fritz on the Fritz and Friends live coding stream and we talked about how Rollbar can be added to your applications to provide better logging, error tracking, and reporting. We walked through the story of Rollbar and added the logging solution to the KlipTok service that manages interactions with internet bots for the various social networks and search engines. See why 100,000+ developers trust Rollbar to analyze, diagnose & fix errors in record time.

Azure Monitor for Windows Virtual Desktop (WVD)

At the end of March 2021, Microsoft released Azure Monitor for Windows Virtual Desktop (WVD) for General Availability. Built upon Azure Monitor Workbooks to give insights into the Windows Virtual Desktop environment, including: Connection Diagnostics, Connection Performance, Host Diagnostics, Host Performance, Utilizations, Users, Clients and Alerts.

Good Catch: Partner Monitoring

Operating in today’s digital economy often involves dealing with an extensive network of third-party providers and partners. Common types of partner networks include affiliates, vendors, suppliers, marketing platforms, and payment gateway providers. Partner networks involve tracking and analyzing data from multiple providers, each of which creates thousands of metrics and billions of events each day.

Application Monitor: Checking Everything that Matters

Application monitor solutions are not novel but rather an evolutionary technology. These types of solutions answer the problems that most developers and DevOps teams encounter when building an application. Application monitor solutions help determine potential defects so developers can take corrective actions quickly. Hence, building an application is no longer complete without application performance monitoring (APM) solutions.

Best 7 Monitoring Tools for Node.js Application

Sometimes, applications do not perform as well as they should. Application developers are responsible for performing preventive and curative maintenance. Customers that use your application as a developer may waste a lot of money attempting to restore the applications without your help. To maintain track of your application's activities, it's best to use an effective monitoring system. Monitoring a Node.js application entails keeping a careful eye on its performance and availability.

SMTP Ports (25, 587, 465, or 2525) - What is SMTP Port? How to Choose the Best and Right SMTP Port?

It can be difficult to choose an SMTP port. When we set up the Simple Mail Transfer Protocol SMTP Server, the first question that comes to mind is this. Which port is the best for SMTP connections? There are a variety of ports to choose from, but which one should you use? Allow me to take you on a journey through the history of each port. It will give you a good understanding of all of the ports, and then we'll talk about which one is optimal for SMTP connections.

New Relic vs Atatus

Application Performance Monitoring (APM) is used to ensure consistent availability, performance, and response times of an application. Websites, mobile applications, and business applications have use cases for monitoring purposes. Although, in the digital world, monitoring use cases expand to the processes, hosts, logs, networks, and end-users including your customers and employees.

How to receive alerts in Slack with Pandora FMS

We are going to learn how to configure a CLI connector for Slack webhooks and use them in Pandora alerts. We will show how to create an app in Slack and link it to the channel where we will receive the alerts, enable a webhook to make possible the communication between Pandora FMS and the Slack channel and configure Pandora Slack CLI and an alert in our Pandora FMS console.