Operations | Monitoring | ITSM | DevOps | Cloud

The latest News and Information on Monitoring for Websites, Applications, APIs, Infrastructure, and other technologies.

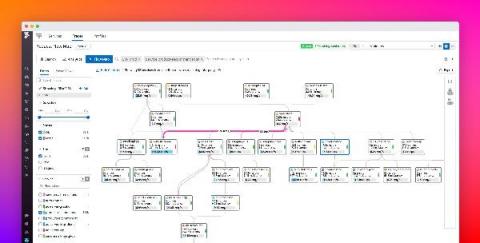
Visualize live dependencies with the Request Flow Map

Modern applications are often composed of countless distributed services, which makes it difficult to understand dependencies, isolate bottlenecks, and remediate errors. Datadog APM helps you tackle this complexity by allowing you to search and analyze 100 percent of your traces in real time. But without a dynamic view of your architecture, it can still be challenging to contextualize a specific request without getting lost in the details.


Observability with Zero Code Instrumentation? Meet eBPF

Current observability practice is largely based on manual instrumentation, which requires adding code in relevant points in the user’s business logic code to generate telemetry data. This can become quite burdensome and create a barrier to entry for many wishing to implement observability in their environment. This is especially true in Kubernetes environments and microservices architecture.

Root out the odd operation with Operations Breakdown

Transactions are sent when your service receives a request and sends a response, like an API call or a page load. Within each transaction is a series of operations. We built Operations Breakdown to help you, the developer, quickly see how much time was spent in each operation within a transaction. Why? Simple, so you can address the operations with the longest duration and likely causing annoying performance issues for your customer.

Create alerts from your logs, available now in Preview

Being alerted to an issue with your application before your customers experience undue interruption is a goal of every development and operations team. While methods for identifying problems exist in many forms, including uptime checks and application tracing, alerts on logs is a prominent method for issue detection. Previously, Cloud Logging only supported alerts on error logs and log-based metrics, but that was not robust enough for most application teams.

How to set up synthetic monitoring at scale with Grafana Cloud

While unit testing and integration testing can give you insight into the individual functionalities of an application, “at times you need some sort of monitoring or testing mechanism which also simulates a user’s behavior to test how the application would work or look to an actual user in the world,” says Grofers Software Development Engineer Yashvardhan Kukreja. That’s where synthetic monitoring comes in.

Managing Microsoft 365? See What You're Missing

If a customer has an issue with any part of Microsoft 365, MSPs just don’t have the native visibility to identify the root cause, let alone respond to and remediate the problem. Most of the time, it’s little more than checking Microsoft’s Service Health status to see if Microsoft knows it’s having a problem.

What is Website Monitoring?

Website Monitoring is a broad phrase used to describe the way web teams measure website reliability, performance and security. In today’s increasingly fast-paced world, website monitoring is becoming much more than that. Businesses have been driven online by socio-economic issues like reductions in retail footfall and, most recently, the Covid-19 pandemic. Websites are critical.

Overcoming SQL Server Blocking and Locking Challenges

One of the most common performance problems with SQL Server databases in production is the blocking of queries, which happens because database resources are locked. Understanding why locking happens is just half the battle. Being able to resolve locking, which will resolve blocking issues as well, is the second half.