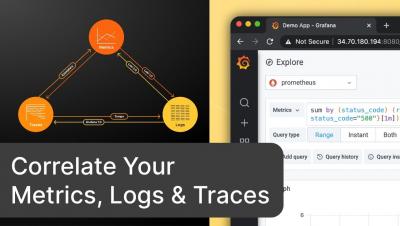
The latest News and Information on Monitoring for Websites, Applications, APIs, Infrastructure, and other technologies.
When you log into your account, you'll notice some subtle and not so subtle changes. We slightly updated our theme, you'll see more rounded corners and tweaked colours of various things in our UI.
Your wishes are being granted. Search is now available for all AppSignal customers. 🎉 You can now quickly find specific samples inside of AppSignal. This is especially useful when searching for an error/slow request for a particular customer in a specific revision or request ID. You can access the search in AppSignal from any screen in an application. It’s located in the dark top bar. Let’s take a look at the new search in action.
Available for Enterprise and Enterprise MSP customers, the new Header Graph (Beta) feature is being rolled out in the v148 release. This time-series graph allows for easy alert grouping to cut down troubleshooting time and quickly identify the resources that are causing an alert storm.
We first released the usage insights Enterprise feature in Grafana 7.0 based on feedback from customers that they would like to better understand how their users are interacting with Grafana, including the dashboards they visit, the information they query, and where they run into issues. What we learned was that dashboard sprawl is a real issue: Administrators estimate that almost 60% of dashboards might not be used at all.
Troubleshooting an application running on Google Kubernetes Engine (GKE) often means poking around various tools to find the key bit of information in your logs that leads to the root cause. With Cloud Operations, our integrated management suite, we’re working hard to provide the information that you need right where and when you need it. Today, we’re bringing GKE logs closer to where you are—in the Cloud Console—with a new logs tab in your GKE resource details pages.
Metricbeat, an Elastic Beat based on the libbeat framework from Elastic, is a lightweight shipper that you can install on your servers to periodically collect metrics from the operating system and from services running on the server. Everything from CPU to memory, Redis to NGINX, etc… Metricbeat takes the metrics and statistics that it collects and ships them to the output that you specify, such as Elasticsearch or Logstash.
Logz.io has always prided itself as a company pushing the use of open source tech. As we have moved to expand our reach with metrics and traces over the past year and a half, we have doubled down on our own contributions to the community. With (distributed) traces in particular, we have been able to forge ahead. Our relationship with the teams at Jaeger and OpenTelemetry have really blossomed (and we are kind of proud to have supported the latter in the run-up to the OpenTelemetry v1.0 release).