Nastel Navigator X - Custom Attributes
This demo covers Custom attributes and how they can be used to display, filter and monitor data managed by Nastel.


The latest News and Information on Monitoring for Websites, Applications, APIs, Infrastructure, and other technologies.
Pingdom is one of the most used website monitoring tools, with almost 15 years in the business. It excels at providing simple and reliable synthetics as well as real user monitoring. This monitoring tool provides a simple public status page, but as you might have noticed it’s quite limited. It only serves as a display of your uptime and response time history, not much more than that.
It shouldn’t be a surprise that Lambda configuration error is one of the most common error messages, and we all know AWS error messages aren’t known for being especially detailed. Oftentimes you will come across other vague error messages like “encoding not enabled,” or “stream is failing,” and depending on the context, this could mean your services could be completely down.
First impressions matter. The first day of a new job can be daunting, especially in a post-2020 world. Back in 2019, you might have asked yourself questions like: is this office going to be open-concept or a bunch of cubicles? Will I get to sit near a window with some natural light or are they going to stick me next to the bathroom? Now new hires ponder questions like: what will my digital work environment look like? Will IT send me a new laptop, camera, and speakers?
Have you ever seen one of those old war movies where some grizzled veteran is whispered to have the fabled ‘1,000-yard stare’? Well, you need to keep an eye for it among IT teams too. IT Support Fatigue was already a very real problem before the pandemic, and has only become more severe in the months since. It’s an issue we explored in the Nexthink Pulse Report.
When you are configuring your event log monitor settings, you need to decide which event log events you need to worry about. Event logs are generated for a wide array of processes, applications, and events. Logs will record both successes and failures. As such, you need to decide what data is most vital and needs your immediate attention.
There is an idea of the relationship between observability and monitoring, that they complement each other in an inseparable way. While true that you can only monitor a system that is observable, the line dividing observability and monitoring grows narrower with every deployment you make; making these two practices less of a pairing and more a single entity.
Logz.io is focused on creating the best observability service to manage the scale of monitoring, add value on top of AI/ML technologies, and enhance enterprise security. Metrics is one of the pillars of Logz.io, and our Prometheus-as-a-Service offering. It has been a crucial part of our platform goals, but if we turn the clocks back a year, our service only used the open-source Elasticsearch database (ES).
Software companies are in a constant pursuit to optimize their delivery flow and increase release velocity. But as they get better at CI/CD in the spirit of “move fast and break things,” they are also being forced to have a very sobering conversation about “how do we fix all those things we’ve been breaking so fast?” As a result, today’s cloud-native world is fraught with production errors, and in dire need of observability.
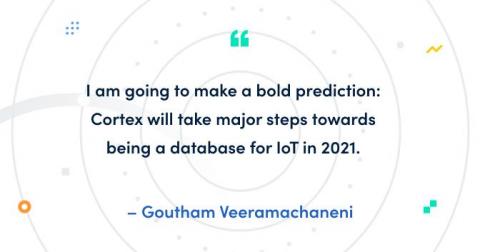
My Grafana Labs colleague RichiH recently talked about why IoT and time series databases work so well together. It just so happens that we have a highly scalable time series database on hand. Let’s talk about that. My name is Goutham, and I am a maintainer for Cortex. I have been working on it for nearly three years out of the four-and-a-half years the project has existed. Cortex is built to serve as a scalable, long-term store for Prometheus.