Operations | Monitoring | ITSM | DevOps | Cloud

The latest News and Information on Monitoring for Websites, Applications, APIs, Infrastructure, and other technologies.

Splunking AWS ECS Part 2: Sending ECS Logs To Splunk

Welcome to part 2 of our blog series, where we go through how to forward container logs from Amazon ECS and Fargate to Splunk. In part 1, "Splunking AWS ECS Part 1: Setting Up AWS And Splunk," we focused on understanding what ECS and Fargate are, along with how to get AWS and Splunk ready for log routing to Splunk’s Data-to-Everything platform.

A Partnership Between InfluxData and Ockam Brings Trust to Time Series Data

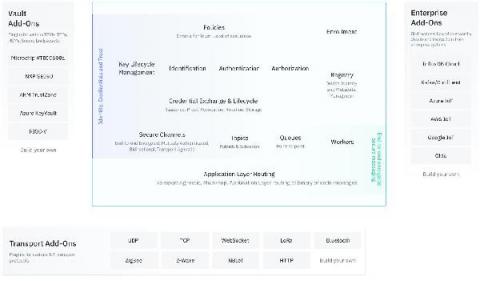
This article is a re-post of the article written by Matthew Gregory and published on the Ockam blog. Let’s investigate how to build applications with trusted time series data in a zero trust environment! To trust an application we need to trust the data that feeds into it. Increasingly, applications rely on time series data from outside the datacenter, at the edge, or in IoT. This means we need to think of trust and data in new ways.

Surveying the Tides of Cloud-Native & Open Source Observability

We can plausibly say the enterprise development market turned the tide on cloud-native development in 2020, as most net-new software and serious overhaul projects started moving toward microservices architectures, with Kubernetes as the preferred platform.

Hosted Prometheus vs. Hosted Graphite

In this article, we will discuss major features, differences, and similarities of the open-source monitoring tools known as Prometheus and Graphite. We will then dive into how you can benefit from MetricFire’s hosted Prometheus and Graphite. Lastly, we will explain why, given the choice, hosted Graphite could be a better monitoring option for you. MetricFire provides comprehensive monitoring solutions with Hosted Prometheus and Hosted Graphite.

How to monitor your Website in just 2 simple steps?

In this video, you’re going to learn exactly how to monitor your Website in just 2 simple steps! To be clear: Monitoring a Website is a lot of hassle. But with this video tutorial, you’ll know how you can monitor your Website in just 2 simple steps while saving a lot of time. Think of Components like folders that contain other Fyipe resources and one of the resources it has is called "Monitors". A website monitor will basically test your Website for availability, performance, and function. I'll also show you how your team is alerted when your website goes down.

Making CI/CD work with serverless

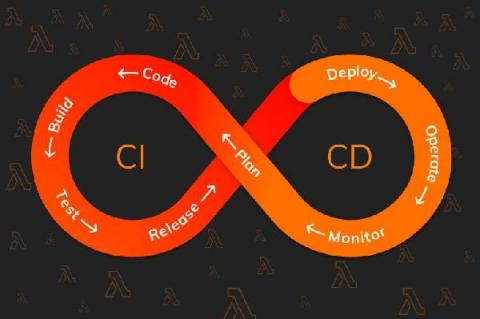
“Serverless computing is a cloud-computing execution model in which the cloud provider runs the server, and dynamically manages the allocation of machine resources. Pricing is based on the actual amount of resources consumed by an application.” — “Serverless Computing”, Wikipedia This mundane description of serverless is perhaps an understatement of one of the major shifts in recent years.

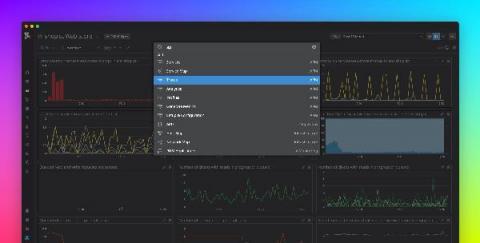
Introducing the Datadog quick nav menu

Datadog’s features give you full visibility into every part of your application environment, so it’s likely you have many resources to switch between as part of your troubleshooting and development workflows. For example, you might switch from the host map to investigate a performance issue with your services in APM, or jump between dashboards to correlate metrics and troubleshoot a problem with your CI/CD pipeline.

Dispelling 7 SLA Myths That Keep Your DevOps Awake at Night

DevOps fits this odd niche between development and oversight. Like any “Wild West” type of position, pretty much anything goes. Your job is to think of everything including the stuff you haven’t thought of yet. You make the rules, and as long as the lights are on you’re considered a success. But alongside that freedom come the rumors and SLA myths that inspire such dread that you write them off as jokes.