Operations | Monitoring | ITSM | DevOps | Cloud
Monitoring
The latest News and Information on Monitoring for Websites, Applications, APIs, Infrastructure, and other technologies.
How to Monitor Physical Desktops and Laptops with eG Enterprise v7.2
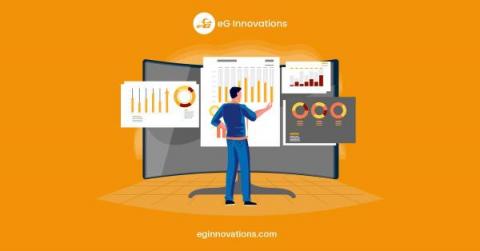
Digital Employee Experience (DEX) and the end user experience is growing in importance. IT teams must ensure that users are satisfied and productive. Many organizations are either moving to hybrid, remote or work-from-home set ups or consolidating end user support teams to support multiple branch offices – this means IT teams are responsible for supporting remote end users if the applications and services are slow or unresponsive.
Logic App Best Practices, Tips, and Tricks: #36 How to process an Array or a single object JSON structure in the same manner
Monitoring Your Elixir GraphQL API with AppSignal
While a GraphQL API may be less susceptible to the common REST API performance issues of under and over-fetching data, allowing users to request and receive a wide range of data in a single, nestable query can also come with performance risks. AppSignal for Elixir now supports Absinthe out of the box, and automatically adds Absinthe spans to your app's metrics. AppSignal also automatically instruments Ecto, giving you insights into your application's queries.
Splunk Sustainability Toolkit V2 Doubling Down on IT Sustainability and Beyond
Improve MTBF and MTTR for your Application Platforms by using MESH Observability
When businesses look at how best to understand the performance levels of their platforms, some of the best incident management metrics to look at are Mean Time Between Failures (MTBF) and Mean Time ToResolution(MTTR). These two measurements will give an excellent indication of the health and speed of the system, as well as the ability of the platform to take care of any anomalies that have been detected or to flag them up for others to take action to resolve them.
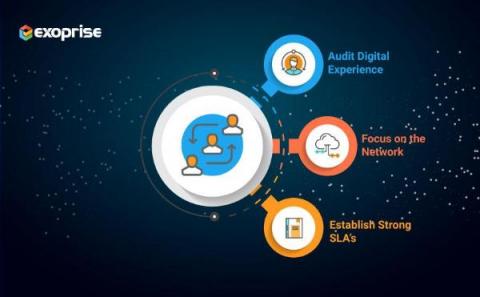
Three Simple Steps to Improve Digital Workplace Collaboration
The pandemic sparked a dramatic uptick in corporate use of collaboration and cloud solutions. A related perpetual challenge is that enterprises do only a mediocre job of providing remote users, especially those working at home, with robust Digital Workplace experiences. As part of improving the enterprise Digital Workplace, Enterprises' must begin to conduct thorough digital inventories, focus on network observability, and enforce strong SLA's with cloud providers to address the shortcomings.
How Coralogix Powers Your Synthetic Monitoring with Checkly
As a leading full-stack observability platform, Coralogix enables you to gather, monitor and analyze your infrastructure and application telemetry. And Coralogix now offers synthetic monitoring for proactive end-to-end testing across development with Checkly.
How to get the best of lexical and AI-powered search with Elastic's vector database
Maybe you came across the term “vector database” and are wondering whether it’s the new kid on the block of data retrieval systems. Maybe you are confused by conflicting claims about vector databases. The truth is, the approach used by vector databases has been around for a few years.


