Operations | Monitoring | ITSM | DevOps | Cloud

Monitoring

The latest News and Information on Monitoring for Websites, Applications, APIs, Infrastructure, and other technologies.

What is Packet Reordering (Out-of-Order Packets) & How to Detect It

Imagine a world where packets go on unexpected detours, performing an electrifying dance routine that challenges the order we hold dear. Sounds intriguing, doesn't it? In the realm of data transmission, order is king. But every now and then, our trusty packets decide to take a detour, throwing caution to the wind and leaving us scratching our heads. Fear not! Today, we embark on an exhilarating exploration to demystify the phenomenon of out-of-order packets, also known as packet reordering.

How Coralogix Powers Your Synthetic Monitoring with Checkly

As a leading full-stack observability platform, Coralogix enables you to gather, monitor and analyze your infrastructure and application telemetry. And Coralogix now offers synthetic monitoring for proactive end-to-end testing across development with Checkly.

How to get the best of lexical and AI-powered search with Elastic's vector database

Maybe you came across the term “vector database” and are wondering whether it’s the new kid on the block of data retrieval systems. Maybe you are confused by conflicting claims about vector databases. The truth is, the approach used by vector databases has been around for a few years.

Carrier reduced MTTR and gained visibility across multiple IT environments

Hear Rich Johnston, Director of Hosting Platforms, describe Carrier’s observability goals to create a unified view of their IT environment for predictive monitoring. Rich describes Carrier’s desire to see issues before customer complaints, and how LogicMonitor implemented extensive visibility on a single platform, including multiple cloud platforms, networking, compute, storage, and more. LogicMonitor helped Carrier quickly and easily deploy dashboards to see how their technology performed, while reducing root cause analysis and shortening resolution time.

Docker Compose Logs: Guide & Best Practices

Docker Compose is a tool for defining and running multi-container Docker applications. It allows developers to streamline the process of configuring, building, and running multiple containers as a single unit with a docker-compose.yml. This configuration file specifies the services, networks, and volumes required for an application, and their relationships and dependencies. The docker-compose logs command displays the logs of all services defined in the docker-compose.yml file.

Our uptime check can now verify response headers

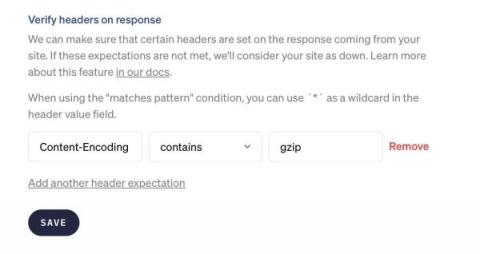
When we make a request to your site to verify that your site is up, the response of your server will contain certain headers. We can verify that those headers contain the values you expect. If these expectations are not met, we'll consider your site as down. In the "Responses" section of the uptime settings page, you can specify which headers we should verify. You could add this expectation to ensure your page uses gzip compression.

Redcentric gained flexible monitoring capabilities across multiple cloud environments

Hear Paul Mardling, Chief Technology Officer, and Ed Jackson, OSS Manager, describe Redcentric’s complex hybrid infrastructure and their difficulties with monitoring tool sprawl when their cloud deployments expanded. Redcentric used LogicMonitor to gain flexible monitoring capabilities across multiple cloud environments to keep up with developer needs. Out-of-the-box data sources and fast, agentless monitoring helped them see everything across thousands of devices in their IT estate, with excellent customer support to help at a moment’s notice.