Operations | Monitoring | ITSM | DevOps | Cloud

The latest News and Information on Monitoring for Websites, Applications, APIs, Infrastructure, and other technologies.

How to Customize & Manage Network Monitoring Dashboards | Obkio NPM Onboarding Series

Welcome! In this video, we’re looking at the “Dashboards” tab in Obkio’s Network Performance Monitoring App. The Network Monitoring Dashboards allow you to visualize all the information and metrics collected from your Obkio account. You can leverage dashboards to analyze and compare information and find answers when monitoring and troubleshooting network performance. In this video, we will show you what you can do at the widget level in a single dashboard, and also, how to manage multiple dashboards in Obkio’s app.

Why holistic monitoring is the key to future-proof your application

The days of monolithic applications and simple monitoring tools are gone. With the arrival of public and private cloud infrastructure and hyperconnectivity on Edge devices, organizations struggle to scale their applications, identify issues before it affects their customers, and to maintain their SLA s. Enter a pplication p erformance m onitoring(APM), a game-changer in the realm of IT operations.

Nexthink is a Leader in the Forrester Wave

We’re thrilled to announce that Nexthink has been recognized as a Leader in the Forrester Wave: End-User Experience Management Solutions, Q3 2024 report! To us, this recognition underscores our commitment to excellence in digital employee experience and our innovative solutions that keep your workforce productive and engaged. Dive into the report to see why Forrester positioned us as a Leader and how we see Nexthink continuing to transform digital workplace strategies.

Splunk vs Prometheus: a Side-by-Side Comparison [2024 Guide]

When it comes to monitoring and observability, Splunk and Prometheus are two prominent tools with distinct strengths. Splunk excels in enterprise-level security and observability, while Prometheus is known for its efficient handling of time-series data. In this blog, I have compared these two tools, focusing on their unique features, and strengths. Remember, some insights may reflect personal preferences, helping you find the best fit for your specific monitoring needs.

Icinga Director: Cloning dictionary row entries for objects from import sources

Over use of dictionaries in monitoring leads to complex and ugly configurations. This in turn makes monitoring complicated. Hence, it is advisable to use it, only if it is needed or in special cases. Even in these cases it is worthwhile to keep it simple. On that note, in this blogpost let me demonstrate how to clone dictionary row entries for objects from import sources to object properties in Icinga Director.

Visualize CockroachDB in Grafana: Introducing the CockroachDB Enterprise data source

We’re excited to announce the addition of CockroachDB as an Enterprise data source for Grafana. The data source, available now in private preview, enables secure and seamless access to the CockroachDB distributed SQL database, while leveraging Grafana’s powerful visualization capabilities.

Three Advanced Notification Features that Your Site Uptime Monitoring Vendor MUST Deliver

To say that site uptime vendors deliver notifications is about as insightful as saying that cars have steering wheels, planes have wings, or TikTok videos have cringe. It’s a given. But this doesn’t mean that all vendors use the same notification playbook. Some vendors offer basic (read: superficial) notification features, while others offer advanced notification features.

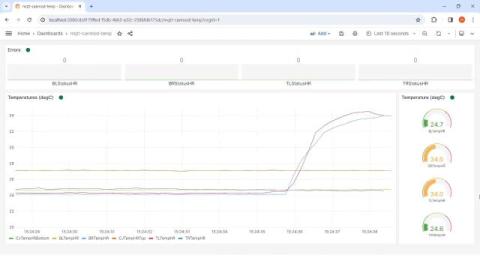
PID Controllers and InfluxDB: Part 2 - Digital Twin

In a previous post, we described a CSTR and a PID controller. This post will cover the code and architecture of the digital twin from this project repo. The project leverages Kafka for data streaming, Faust for data processing, InfluxDB for storing the time series data, and Telegraf for writing data from the topic to InfluxDB. We’ll also cover the advantages and disadvantages of this stack.