Operations | Monitoring | ITSM | DevOps | Cloud

Monitoring

The latest News and Information on Monitoring for Websites, Applications, APIs, Infrastructure, and other technologies.

Your Telemetry Data is Faster, Is Your Analysis?

Continuous intelligence (CI) platforms can be used to collect telemetry data from various sources, perform analysis on that data, make inferences about the data, and provide real-time insights that help businesses understand what’s going on. For years, network, application performance, and security monitoring were fairly passive operations. Systems collected key telemetry data, and operators received alerts when a particular metric crossed a preset threshold. Operations were limited in two ways.

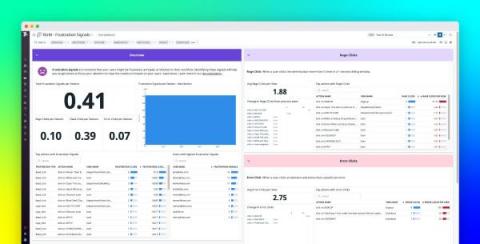
Detect user pain points with Datadog Frustration Signals

Whether you run an ecommerce site, a digital publication, or any other customer-facing service, delivering optimum user experiences is key to the success of your business. Customers can grow frustrated and abandon your site when they run into hurdles such as JavaScript errors or confusing page designs, and that frustration negatively impacts your company’s bottom line.

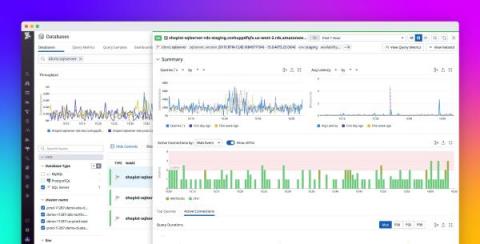
Analyze wait events and in-flight queries with the Datadog Database List

When you’re operating databases at scale, being able to get real-time insights across all your databases is essential for addressing issues and identifying areas for optimization. Datadog Database Monitoring’s Database List allows you to monitor your entire database fleet in one place, so you can quickly identify and troubleshoot overloaded hosts and gauge the impact of problematic queries throughout your infrastructure.

Get Started with Python Error Reporting

Python is one of the most industry-oriented languages. It has versatile usability and features that are great for all types of tech teams. You can make both frontend websites and backend APIs with Python. According to a report by Statista, around 48.24% of the developers worldwide use Python as one of their programming languages. Python is a backend technology in most cases, so monitoring the application is very important. The backend is the backbone of the application.

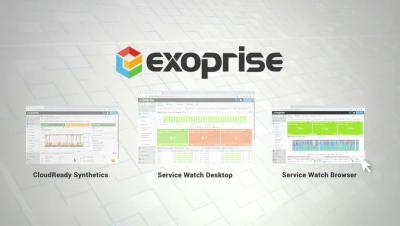
Digital Experience Monitoring from Exoprise (Intro video)

Digital Experience Monitoring (DEM) from Exoprise offers a unique solution combining proactive monitoring with synthetics and endpoint monitoring with RUM. We call it Better Together! Using the Exoprise DEM solution, enterprises can empower IT to support work-from-anywhere initiatives. Whether your team is interested in 24*7 monitoring of Microsoft 365 or complete coverage of third-party services like Zoom, Exoprise has it all.

3 Enterprise IT Factors That Will Make MSPs More Successful in 2022

A version of this blog first appeared in APMdigest. A new study by OpsRamp on the state of the Managed Service Providers (MSP) market concludes that MSPs face a market of bountiful opportunities but must prepare for growth by embracing complex technologies like hybrid cloud management, root cause analysis and automation.

Cloud, Visibility, and Security

Three great things that do not always work great together. In the beginning there were large computer systems that few organizations could afford. Over time these systems became smaller and cheaper and many (if not most) organizations took advantage of them. Some just at the end-user level (i.e. the IBM PC on the desk), some only at the high-end level (i.e. a mainframe in the data center with terminals on desks), and some in a combination of both (anyone remember Reflection?).

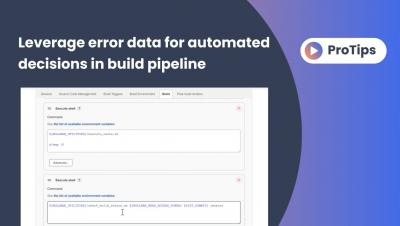
Leverage error data for automated decisions in build pipeline

Discover how you can leverage Rollbar’s Versions API to make an automated decision in a build pipeline. Rollbar is the leading continuous code improvement platform that proactively discovers, predicts, and remediates errors with real-time AI-assisted workflows. With Rollbar, developers continually improve their code and constantly innovate rather than spending time monitoring, investigating, and debugging.