Operations | Monitoring | ITSM | DevOps | Cloud
Logging
The latest News and Information on Log Management, Log Analytics and related technologies.
Unique Tracing Cost Optimization - UP TO 90% SAVINGS!
Connect your Lambda Function to Coralogix in 3 CLICKS
Head in the Clouds (ft. Jo Peterson): Over-tooling Data is Overrated
Understanding Observability: The Key to Effective System Monitoring
How to reindex your Elasticsearch data
The Elasticsearch reindex API copies data from one index to another. You can use reindex to change the index mapping, copy data to another cluster, or copy only a subset of data to another index. For example, suppose you want to reindex all the data in index1 into index2. In that case, you run the following example in Kibana dev tools: In this article, we dive into some common issues solved by reindexing as well as troubleshooting issues with reindexing itself.
6 easy ways to improve your log dashboards with Grafana and Grafana Loki
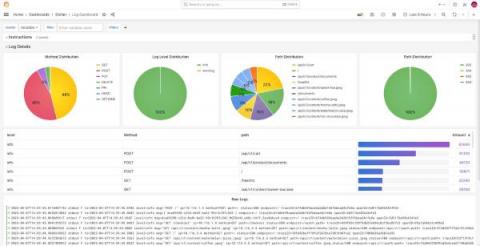
Because of where you’re reading this post, I’m going to assume you already know that Grafana is a great tool for visualizing and presenting metrics, and persisting them on dashboards. Ever since the Grafana Loki query builder for LogQL was introduced in 2022, it’s been easy to display and visualize logs, too.
Gain insights into Kubernetes errors with Elastic Observability logs and OpenAI
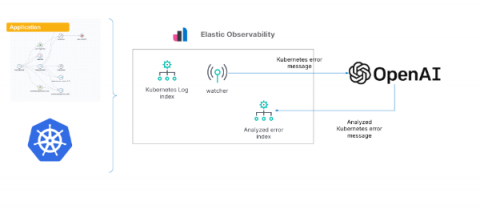
As we’ve shown in previous blogs, Elastic® provides a way to ingest and manage telemetry from the Kubernetes cluster and the application running on it. Elastic provides out-of-the-box dashboards to help with tracking metrics, log management and analytics, APM functionality (which also supports native OpenTelemetry), and the ability to analyze everything with AIOps features and machine learning (ML).
Transport Your Logs to AppSignal with Winston
AppSignal Logging gives you 360-degree insights into your application's performance. To help give you those insights, we wanted to ensure our logging solution allowed you to send AppSignal your logs your way. You can now use Winston transport to send your Node.js application's logs directly to AppSignal and take advantage of having access to all of your application's performance logs and metrics in one place.
A Log's Life Cycle in Coralogix
Coralogix is a full-stack observability platform that effortlessly processes logs, metrics, traces, and security data. More specifically, logs in Coralogix are processed in larger volumes than almost any other observability provider out there, making a log’s life cycle unique. This article will examine the different stages of logs and help you better understand one of the most sophisticated telemetry processing architecture on the market.


