Operations | Monitoring | ITSM | DevOps | Cloud

Monitoring

The latest News and Information on Monitoring for Websites, Applications, APIs, Infrastructure, and other technologies.

Managing High Volume with OpenTelemetry

As your systems grow, so do the challenges of managing high-volume telemetry data. From horizontal scalability strategies to efficient data aggregation and storage techniques, we'll cover everything you need to know to keep pace with your expanding infrastructure. Don't let scalability constraints hinder your observability efforts—learn how OpenTelemetry can empower you to manage high volumes of telemetry data effectively and efficiently.

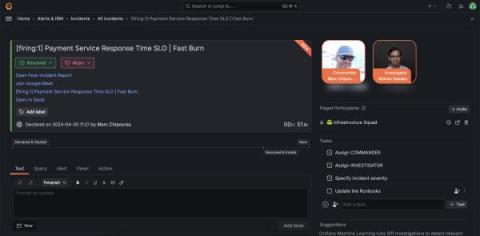
Grafana Incident: new tools for faster, simpler incident response

At Grafana Labs, we’re committed to helping teams dramatically improve how they manage and respond to incidents. Through Grafana Incident Response & Management (IRM), we provide tools to empower teams, streamline processes, and enhance the effectiveness of incident management strategies—and we’re constantly looking for ways to make our solution even better.

Deploying The ELK Stack on Kubernetes

The ELK (Elasticsearch, Logstash, and Kibana) stack’s main objective is to aggregate logs, but the vastly popular open-source project has numerous uses alongside aggregating logs. ELK can easily integrate with Kubernetes and is a common solution that enables users to gather, store, and examine Kubernetes telemetry data. However, with the continual rise of micro-service architecture, users are searching for an improved method of aggregating and searching through logs for debugging purposes.

Data source security in Grafana: Best practices and what to avoid

Recently, an incorrect security report was published, claiming that there’s a SQL injection attack in Grafana. As we have communicated to the security researcher, this report is wrong. Authenticated users in Grafana have the same permissions as the user configured for the underlying data source.

Summary Report: Mastering Cloud Cost Optimization in 2024

We’re back with this year’s cloud cost report. This time around, we’re mixing things up a bit. Don’t worry. You’ll still get an in-depth look at cloud cost in the FinOps industry, but you’ll get more insights with our data-driven results from leading reports and Anodot’s customers. If you’re already reaching out to grab that report, you can find it here.

Understanding Dashboards in Grafana | Panels, Visualizations, Queries, and Transformations

Gain a fundamental understanding of what Dashboards are in Grafana and how they can be used to visualise your data to ensure your systems remain healthy and operational. We'll cover the must know concepts, including panels, visualizations, queries, and transformations, that will ensure you have all the tools you need to build awesome dashboards in Grafana. Chapters: ☁️ Grafana Cloud is the easiest way to get started with Grafana dashboards, metrics, logs, and traces. Our forever-free tier includes access to 10k metrics, 50GB logs, 50GB traces and more. We also have plans for every use case.
Sponsored Post

Branch Office Monitoring With EUEM

The modern workforce has become increasingly remote and distributed, necessitating the need for monitoring solutions to ensure optimal performance in branch offices. Employee Experience Monitoring or Digital experience monitoring (DEM) has emerged as the critical tool for IT teams and businesses to address the challenges associated with remote work environments. This article combines two informative pieces to provide a comprehensive guide on how to monitor remote branch offices using DEM.

How To Build A Status Page In 10 Minutes

A well-built status page is an open communication channel during outages, helping with transparency and trust. According to the research ordered by IBM, the cost of IT downtime reaches $400,000 per hour for enterprises, so learning how to build a status page for your digital product or service can be invaluable for your company. Creating a status page for your company or product ensures transparency and builds trust by keeping users informed, potentially preventing loss of reputation and revenue.

Network Observability from HPE OpsRamp

Proactively manage and address network challenges, reduce downtime and enhance overall operational efficiency. OpsRamp, a Hewlett Packard Enterprise company, provides a comprehensive IT operations management platform that includes powerful network observability capabilities to ensure the performance, reliability, and security of network infrastructure.