Operations | Monitoring | ITSM | DevOps | Cloud

Monitoring

The latest News and Information on Monitoring for Websites, Applications, APIs, Infrastructure, and other technologies.

How to visualize your network using topology maps

Topology maps offer a comprehensive overview of your entire network through a single console, enabling you to respond quickly to any issues that may arise. You can create custom network maps that arrange your network devices and their connections logically and hierarchically over a predefined or custom background so you can visualize how your network is structured and how it operates.

NiCE Active 365 Management Pack 4.3 for Microsoft SCOM and Azure

We are thrilled to announce the release of the latest version of the NiCE Active 365 Management Pack v4.3 for Microsoft SCOM, packed with exciting features and enhancements based on valuable feedback from our customers like you. Our focus on optimizing Azure Monitoring, refining naming conventions, and enhancing collector performance ensures a seamless monitoring experience tailored to your needs.

Announcing AI Error Resolution

After months of anticipation (and invaluable input from our beta testers!) we’re so excited to officially share AI Error Resolution. We can say firsthand that this tool helps developers resolve issues with renewed speed and accuracy, using AI-powered suggestions on the root cause of errors and how to fix them. Testing has shown how effectively this feature can pinpoint the source of an error and produce the most efficient method to resolve it, accelerating the entire debugging process.

Every second counts in our UI

Downtime has always been shown in minutes, hours, and days but for shorter downtimes you would see "0m" even if the actual downtime was less than a minute. We've updated the UI to show downtime in seconds. This means no more manually calculating brief outages — you’ll see exactly how long the system was down :) Did you know you can add notes to downtime periods?

How to Monitor & Identify Google Meet Performance Issues

Virtual meetings have become essential for businesses, connecting teams and enabling collaboration from anywhere. Google Meet has been a reliable platform for these meetings, but ensuring smooth performance requires some know-how. In this article, we'll break down how to monitor and identify Google Meet performance issues. Whether you're an IT professional, network admin, or remote user, this guide is tailored to help you optimize your virtual meetings.

Revealing unknowns in your tracing data with inferred spans in OpenTelemetry

In the complex world of microservices and distributed systems, achieving transparency and understanding the intricacies and inefficiencies of service interactions and request flows has become a paramount challenge. Distributed tracing is essential in understanding distributed systems. But distributed tracing, whether manually applied or auto-instrumented, is usually rather coarse-grained.

This Earth Day, Gain New Sustainability Insights from your IT Infrastructure with OpsRamp and HPE

It’s April 22 and everybody knows today is Earth Day. But do you know how much energy your IT infrastructure is consuming and what that translates to in cost and carbon footprint? As we place more demands on our IT infrastructure to store and manage the reams of data we’re collecting and run advanced analytics and artificial intelligence on that data, we are inevitably consuming more energy in our data centers.

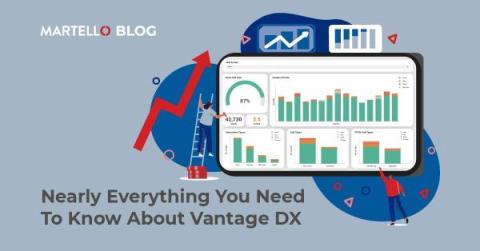
Nearly Everything You Need To Know About Vantage DX

Vantage DX, the only Experience Management Solution purpose-built for Microsoft Teams. This might well be your first-time hearing about Vantage DX. If it is…welcome! We’re here to help enterprises improve their communication and collaboration by giving them the tools they need to understand what is and isn’t working with their Microsoft Teams setup. Here’s just a quick starter to give you some idea of what Vantage DX is capable of.

Jaeger vs Tempo - key features, differences, and alternatives

Both Grafana Tempo and Jaeger are tools aimed at distributed tracing for microservice architecture. Jaeger was released as an open-source project by Uber in 2015, while Tempo is a newer product announced in October 2020. Jaeger is a popular open-source tool that graduated as a project from Cloud Native Computing Foundation. Grafana Tempo is a high-volume distributed tracing tool deeply integrated with other open-source tools like Prometheus and Loki.