Operations | Monitoring | ITSM | DevOps | Cloud

Monitoring

The latest News and Information on Monitoring for Websites, Applications, APIs, Infrastructure, and other technologies.

Optimize Network Performance Management with AppNeta

Regardless of an organization’s industry or size, virtually every critical business activity or service is at least partly reliant upon network connectivity. When network performance slows or issues arise that halt critical end-user services, it can be very costly to an organization. Lost employee productivity, eroded customer loyalty, and reduced sales can all be among the ramifications for even relatively brief service interruptions.

Supercharging Elasticsearch with the Power of Telemetry Pipelines

Elasticsearch has made a name for itself as a powerful, scalable, and easy-to-use search and analytics engine, enabling organizations to derive valuable insights from their data in real-time. However, to truly unlock the potential of Elasticsearch, it is essential that the right data in the right format is provisioned to Elasticsearch. This is where integrating a telemetry pipeline can add value to Elasticsearch.

Why Am I Seeing NGINX 502 Bad Gateway: PHP-FPM?

The NGINX Error 502 Bad Gateway is a common error among website users. There are various possible reasons for this error and different ways to solve it. In this article, we will look at the main possible causes and how they can be solved by users and web developers. Use MetricFire's platform to analyze your system’s performance and troubleshoot errors.

Gaming Industry: How Important are Logs for Systems?

In today’s fast-paced and highly-competitive gaming industry, providing a seamless and enjoyable gaming experience is essential to retain users. Games need to be responsive, offer high-resolution graphics, continuous uptime, and handle a huge amount of transactions. Having strong log analytics solution is essential to improve performance, identify issues, and fine-tune the player experience.

Find connections and expand your data visualization with new dashboards

One of my favorite movies of all time is WarGames, which depicted a teenage hacker accidentally breaking into NORAD and starting a nuclear war simulation that almost turned into a real catastrophe. The movie featured state-of-the-art dashboards (at least for 1983) showing simulated missile launches by different countries. Now you can create Sumo Logic dashboards like the ones shown in this movie using our new Connection Map panel.

Introducing Internet Performance Monitoring: How does it help?

Catchpoint and ITOps Times break down 6 critical topics you need to understand to ensure Internet Resilience for your business in this bi-weekly microwebinar series, each lasting less than 10 minutes. Explore each of the topics in the series: In this second installment, we’ll dive deeper into the world of Internet Performance Monitoring (IPM). Learn how IPM can help you proactively find and fix issues in your Internet Stack before they impact the business.

7 Quick Tips for Working with Traces in OpenTelemetry

Avoiding vendor lock-in is a ‘must’ when it comes to working with new services. Those in ITOps, DevOps, or as an SRE also don’t want to be tied to specific vendors when it comes to their telemetry data. And that’s why OpenTelemetry’s popularity has surged lately. OpenTelemetry prevents you from being locked into specific vendors for the agents that collect your data.

Cost-Cutting Strategies and Smart Tooling Choices to Maximize Your Vendor Budget

Tech debt. Vendor redundancy. System fragmentation. Startups and cloud–born companies are looking at vendors for cost-cutting opportunities. But how do you balance vendor costs and value when those resources and tools bring efficiencies as high as the monthly bills? In this session, Charity Majors and Gergely Orosz share advice on managing spend in a vendor-dependent world.

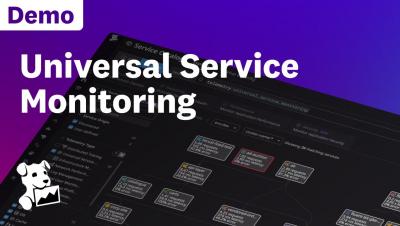
Datadog Universal Service Monitoring Demo

See how you can get instant visibility into the health of your entire fleet of services—without requiring you to change a single line of code. By automatically discovering, mapping, and monitoring every service and dependency, Universal Service Monitoring allows you to detect issues faster, monitor service performance and SLOs across entire environments, and centralize all the knowledge about your services in a single place.

Multiple players, one stack: Inside Roblox's centralized observability stack

When you sign into the Roblox platform, you get 30 million immersive experiences, ranging from concerts to fashion shows to, of course, video games. But when the observability team at Roblox logs on, they’re not playing around. The Roblox observability engineers are responsible for keeping more than 214 million monthly users happy and engaged by making the wildly popular gaming platform highly available around the world.