Operations | Monitoring | ITSM | DevOps | Cloud

Monitoring

The latest News and Information on Monitoring for Websites, Applications, APIs, Infrastructure, and other technologies.

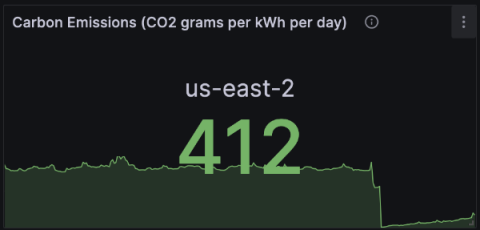
Going green: How to monitor your cloud carbon footprint using Kepler, Prometheus, and Grafana

At this point, the technical and operational benefits of cloud computing are pretty much indisputable. But the cloud industry, as a whole, still has a long way to go in one critical area: sustainability. In fact, as shocking as it may sound, it’s estimated that cloud data centers have a greater carbon footprint than the entire aviation industry. Ida Fürjesová and Niki Manoledaki, both software engineers at Grafana Labs, are passionate about helping to change that.

Lessons learned from running a large gRPC mesh at Datadog

Datadog’s infrastructure comprises hundreds of distributed services, which are constantly discovering other services to network with, exchanging data, streaming events, triggering actions, coordinating distributed transactions involving multiple services, and more. Implementing a networking solution for such a large, complex application comes with its own set of challenges, including scalability, load balancing, fault tolerance, compatibility, and latency.

Introducing Relational Fields

We’re excited to bring you relational fields, a new feature that allows you to query spans based on their relationship to each other within a trace. Previously, queries considered spans in isolation: You could ask about field values on spans and aggregate them based on matching criteria, but you couldn’t use any qualifying relationships about where and how the spans appear in a trace.

What is a Subnet Mask? Examples, Uses and Benefits

“What is a subnet mask?” is among the most common questions for aspiring network engineers. Network veterans have all been through it at one stage or another and we all have our tips and tricks for figuring them out. But, that initial understanding is typically a grind involving some combination of cheat sheets, IP to binary converters, books, articles, and online resources.

Every second counts in our UI

Downtime has always been shown in minutes, hours, and days but for shorter downtimes you would see "0m" even if the actual downtime was less than a minute. We've updated the UI to show downtime in seconds. This means no more manually calculating brief outages — you’ll see exactly how long the system was down :) Did you know you can add notes to downtime periods?

Sumo Logic Flex Pricing: Is usage pricing a good idea?

When discussing observability pricing models, there are three dimensions that must be considered The first, Cost per Unit, is an easy-to-understand metric, but in practice it is often overshadowed by a lack of transparency and predictability for other costs. The question is simple: how does a usage based pricing model impact these variables?

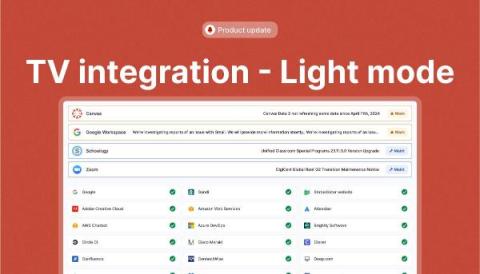
TV integration - introducing the Light mode

We just launched a new feature requested by a new users: a light mode for our TV integration. As a reminder, the TV integration is a specially-formatted version of your status page designed to display on a TV. The new light mode is a useful addition that can enhance the readability of your status page on large screens in certain lighting conditions. Or, if you rotate your display with several other screens which have similar light styles, you can now enjoy a better level of consistency across screens.

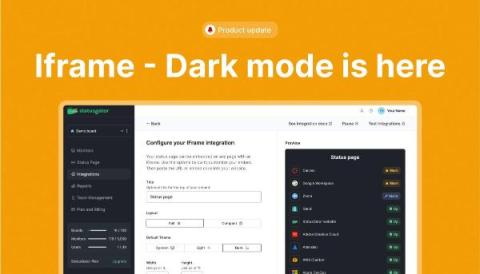
Iframe integration - meet Dark mode

Meet another update for our Iframe integration! What’s changed? This update brings a dark-mode option for users whose websites or portals are designed with a dark theme in mind. With dark mode for Iframe integration, you now have the flexibility to ensure that your embedded status pages align perfectly with the aesthetic of your website or portal and that your text is readable.
Sponsored Post

Navigating Industry-Specific Challenges in IT Infrastructure Monitoring and Automation

In navigating the intricate landscape of IT infrastructure, NiCE IT Management Solutions' whitepaper delves deep, unraveling the historical tapestry shaping the contemporary technological terrain. It dissects industry-specific challenges, offers tailored insights into crafting monitoring and automation solutions, and spotlights key players' pivotal roles. Real-world applications showcase how these technologies drive operational excellence, emphasizing the necessity of skillful guidance through monitoring and automation in today's business environments.